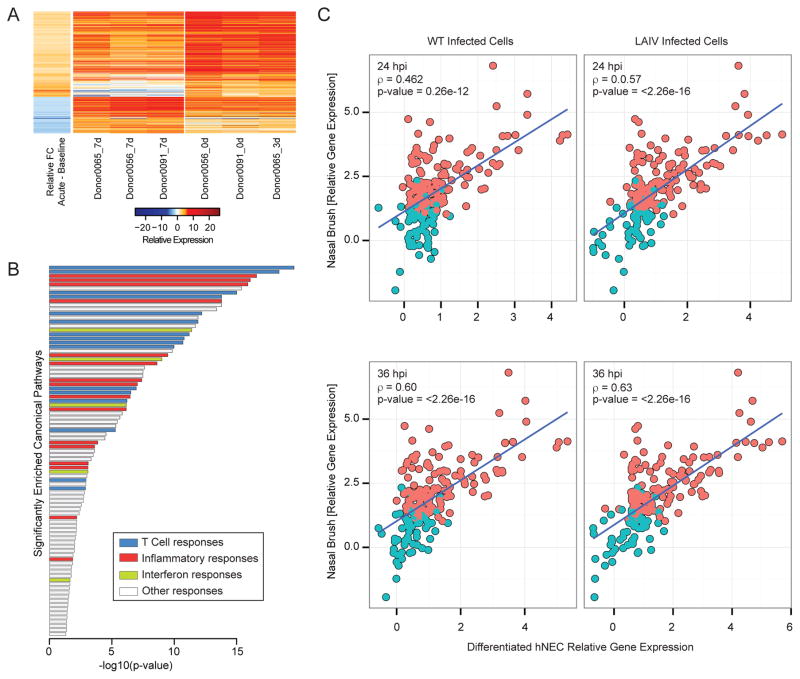
Figure 5. Host transcriptional profiling in nasal swabs of patients infected with H3N2 influenza virus.
Gene expression profile in nasal washes derived from H3N2-infected donors. (A) Heatmap represents the log2-transformed gene expression at baseline (7 days post-visit) or during acute infection (time of visit or 3 days post initial visit, as indicated) across three donors (2 male and 1 female). The average ratio of differential expression (donor-matched acute infection samples vs. baseline samples) is presented in the first column. Columns 2–7 represent the log2-transformed gene expression at baseline (columns 2–4) or at time of initial clinical visit (columns 5–7). (B) Gene set enrichment of canonical pathways of the 577 genes differentially expressed early during acute infection relative to baseline using IPA. Bar graph represents pathways with significant enrichment scores (enrichment score > 1.3). Bar length represents the enrichment scores, which are based on the −log10 p-value as determined by Fisher’s exact test. Bar color determines the distinct biological functions that the enriched canonical pathways are predicted to affect. (C) Correlation of hNEC and nasal epithelium-derived transcriptional responses following IAV infection. Responses to WT and LAIV infection in hNEC cultures (x-axis) were correlated to those observed during acute infection with H3 IAV (y-axis). Each bubble in the graph represents a DE gene in hNEC cultures. Pink color represents genes that were determined to be DE in the nasal brush, while blue color represents genes that did not pass statistical cut-off for differential expression in the nasal brush. The Spearman correlation coefficient, r, is depicted for each contrast.

