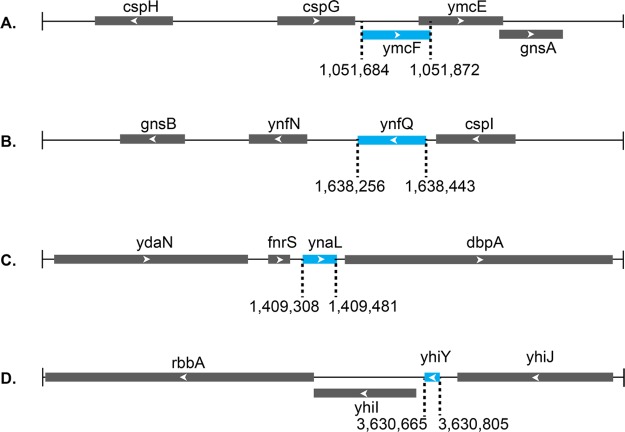
Figure 3.
Gene locus diagrams for nonannotated E. coli proteins YmcF (A), YnfQ (B), YnaL (C), and YhiY (D). Line represents chromosomal DNA, annotated protein-coding sequences are represented by gray boxes, and newly reported coding sequences are represented by blue boxes. Arrows indicate 5′–3′ directionality of the coding sequence. Sizes are proportional to length, and genomic coordinates of novel protein sequences are provided. Sizes of novel proteins were calculated either from the first in-frame ATG to stop codon (C, D) or from experimentally determined non-ATG start codons (A, B, vide infra).

