
Figure 5.
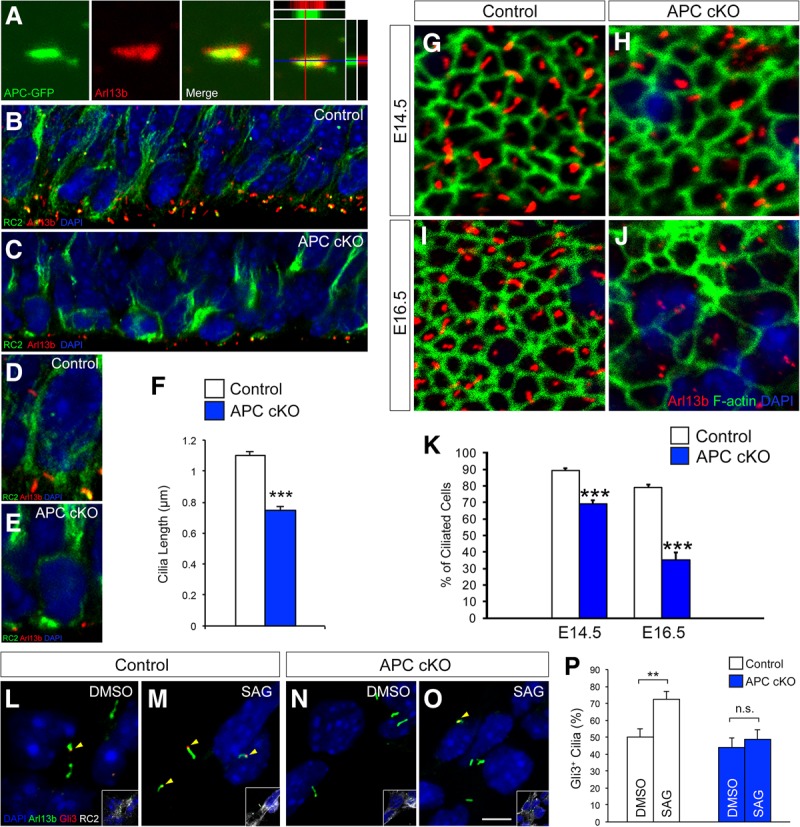
Primary cilium defects in APC-deficient radial progenitors. (A) Electroporated APC-GFP colocalizes with Arl13b, a primary cilium marker, in radial progenitors. (Right) Optical line scans (X–Z and Y–Z) through this image show colocalization. (B–E) Deletion of APC initially leads to shorter primary cilia in RGCs. Low-magnification images of primary cilia at the ventricular surface (B,C) and high-magnification images of RC2+ RGCs (D,E) are shown. (F) Quantification of primary cilium length in control and APC cKO cortices (E16.5). Data shown are mean ± SEM. n = 4 for each genotype. (G–J) Loss of APC leads to primary cilium maintenance defects. En face view of progenitor cilia on the ventricular surface at E14.5 (G,H) and E16.5 (I,J). By E16.5, substantial loss of primary cilia is evident in APC cKO. (K) Quantification of changes in the number of ciliated progenitors. Data shown are mean ± SEM. n = 3 for each genotype. (L–P) Shh signaling is perturbed in APC cKO progenitors. RC2+ cortical progenitors from control and APC cKO were treated with 200 nM SAG. SAG treatment leads to an increase in Gli3 localization to primary cilium tips (arrowheads) in control, but not in APC cKO, progenitors. Insets show RC2 labeling of radial progenitors shown in each panel. (P) Quantification of primary cilia with Gli3 at tips. Data shown are mean ± SEM. n = 3 for each condition. (**) P < 0.01; (***) P < 0.001, Student's t-test. Bars: A, 1 µm; B,C, 6 µm; D,E,G,H, 3 µm; I,J, 4 µm; L–O, 5 µm.