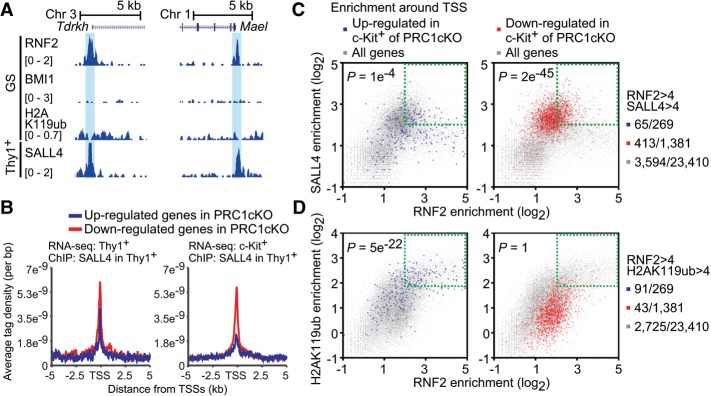
Figure 4.
RNF2 and SALL4 together occupy TSSs of germline genes for activation. (A) Binding peaks of RNF2, BMI1, H2AK119ub, and SALL4 across the Tdrkh and Mael gene loci in GS cells and cultured Thy1+ spermatogonia. Double-positive peaks (RNF2 and SALL4) are highlighted in blue. (B) Occupancy of SALL4 around TSSs in wild-type GS cells. ChIP-seq data of cultured Thy1+ spermatogonia are shown for the indicated genes based on RNA-seq analysis. (C,D) Scatter plots showing enrichment of ChIP-seq intensity (±2 kb around TSSs) on genes regulated in c-Kit+ spermatogonia (up-regulated genes are in the left panel, and down-regulated genes are in the right panel). Distribution of all genes is shown with gray dots. P-values are based on hypergeometric probability tests for genes with enrichment greater than four for both RNF2 and SALL4 (C) and for both RNF2 and H2AK119ub (D). The numbers of genes are shown at the right.

