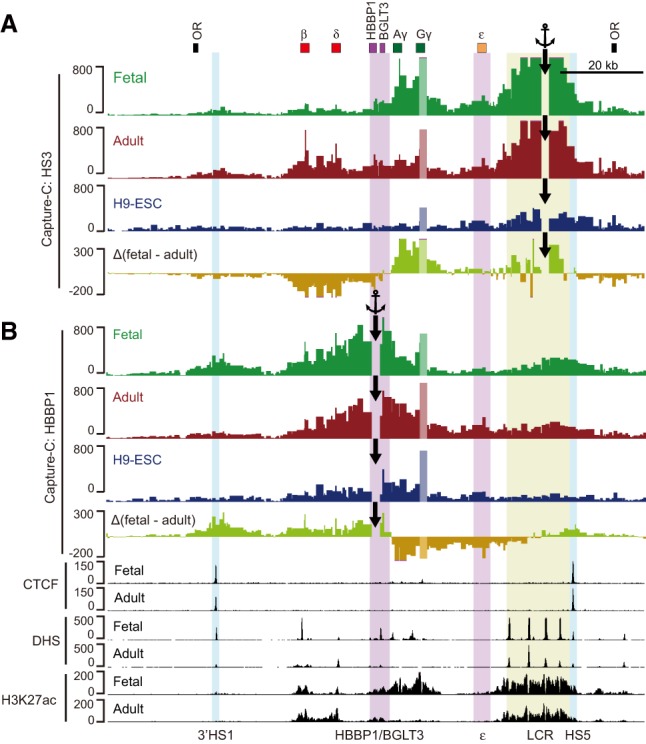
Figure 4.

Chromatin interaction profiles of the β-globin locus. (A,B) Capture-C anchored on HS3 (A) and HBBP1 (B) in fetal and adult erythroblasts or H9-ESCs. The anchor positions are indicated by black arrows. The Δ(fetal − adult) tracks show the subtraction of normalized fetal and adult Capture-C interactions. (OR) Olfactory receptor genes.
