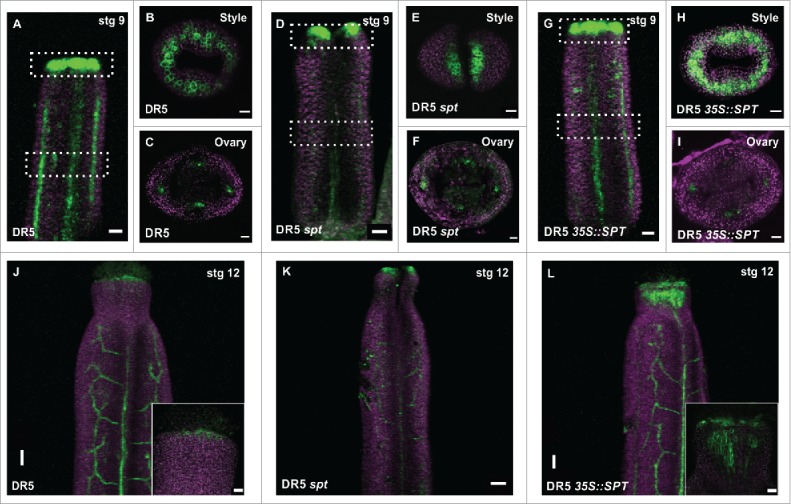
Figure 1.

SPT affects the auxin response in the gynoecium. (A-L) Confocal laser scanning microscope (CLSM) imaging of the fluorescence signal of the auxin transcriptional response reporter DR5rev::GFP in stage 9 gynoecia of wild type (A-C), spt-2 (D-F), and 35S::SPT (G-I). White pointed boxes in (A, D, G) indicate the regions of observation, from the top (B, E, H) or in transverse sections (C, F, I). (J-K) DR5 signal expression in stage 12 gynoecia of wild type (J), spt-2 (K), and 35S::SPT (L). GFP signal in green; Propidium iodide (PI) counter stain in purple. Scale bars: 50 µm (J-L), 20 µm (A, D, G; inset in J, L), 10 µm (B, C, E, F, H, I).
