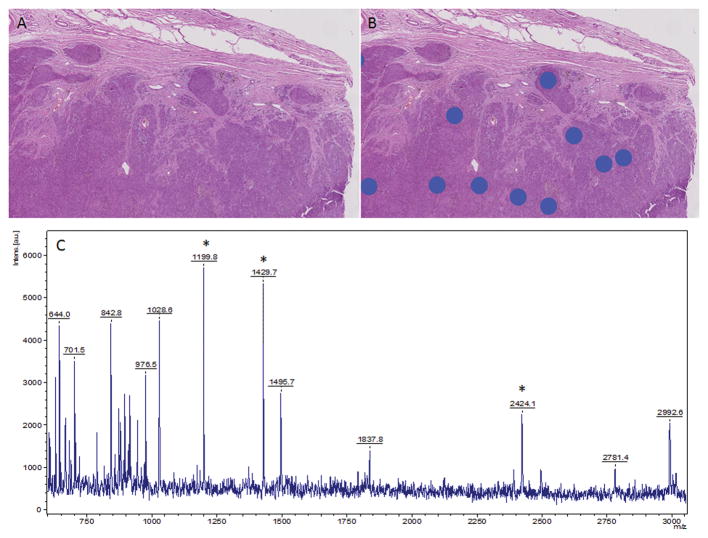
Figure 6.
Histology directed mass spectral analysis. Hematoxylin and eosin stained section of the tissue without (A) and with (B) annotations for areas of mass spectral data collection. C) Representative mass spectra taken from a region under one of the blue dots in (B). *Highlight selected peaks are part of the classification algorithm.

