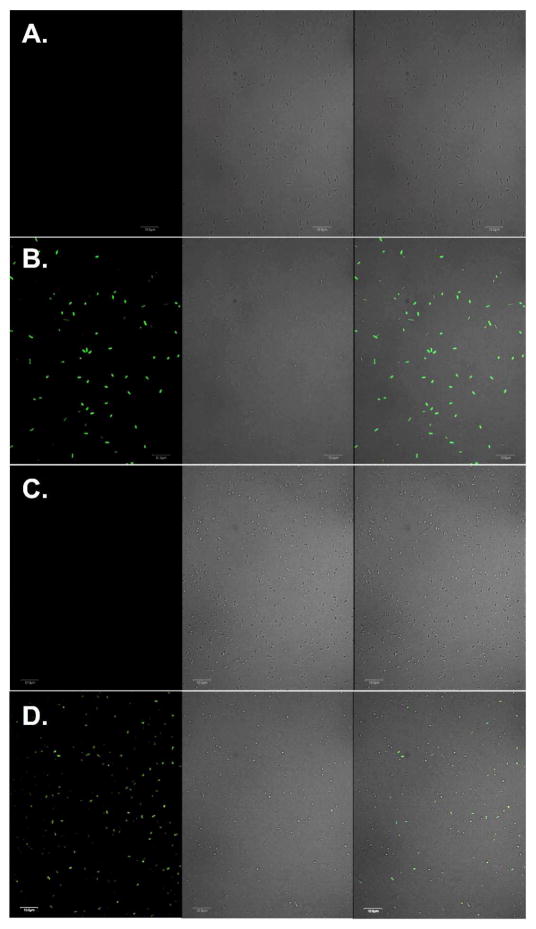
Figure 6.
Fluorescence imaging of live E. coli cells expressing sfGFP variants. (A) E. coli cells expressing sfGFP-Tyr66ViP before the addition of Hg2+; (B) E. coli cells expressing sfGFP-Tyr66ViP after the addition of Hg2+; (C) E. coli cells expressing cpsfGFP-Tyr66ViP before the addition of Hg2+; (D) E. coli cells expressing cpsfGFP-Tyr66ViP after the addition of Hg2+. Left-panels are fluorescent images of E. coli cells in FITC channel (488 nm excitation and 525±25 nm emission), middle panels are bright-field images of the same E. coli cells, right panels are composite images of bright-field and fluorescent images. Scale bars, 10 μm.

