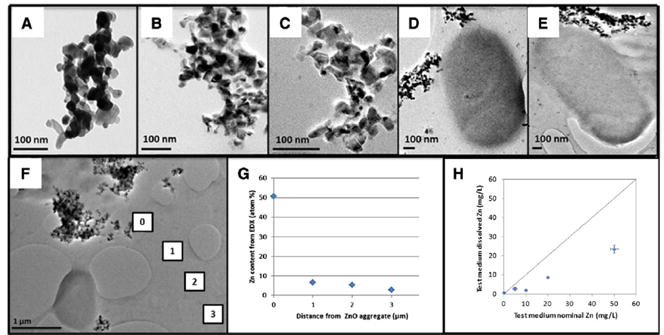
Figure 3. Transmission Electron Microscopy (TEM) of ZnO-NPs in the exposure media.

Images of ZnO-NPs in: A) HPLC water, B) LB-broth at 0 h, C) LB-broth at 24 h, D) LB-broth with bacteria (OP50) at 0 h, E) LB-broth with bacteria (OP50) at 24 h. F) Energy-dispersive X-ray spectroscopy (EDX) analyses and chemical mapping on four micron-sized windows were performed to determine: G) the percentage of Zn content, H) the relative dissolution rate quantified (H). Adapted from Polak et al.[49]
