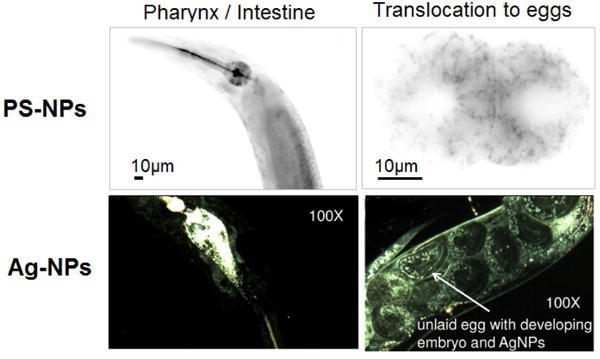
Figure 5. Use of fluorescence and hyperspectral imaging to characterize NP pharmacokinetics.

Worms fed on a bacterial together with PS-NPs and Ag-NPs. Upper panels show epifluorescence images of carboxy 50-nm PS-NPs in the intestine (left) and cytoplasm of early embryos (right). Adapted from Scharf et al.[51] Lower panels present hyperspectral images showing 10-nm citrate Ag-NPs in the intestine (left) and transference to the offspring (right). Ag-NP identity was confirmed by hyperspectral analysis. Adapted from Meyer et al.[33]
