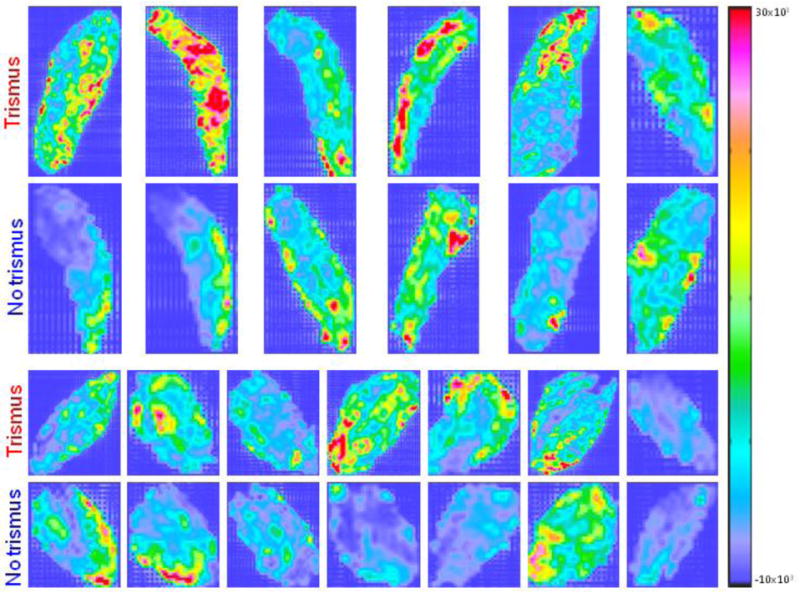
Figure 3.

The middle axial slice of the Haralick Correlation (GLCM) texture distribution within the ipsilateral masseter (two upper rows) and the ipsilateral medial pterygoid (two bottom rows) for the cases and controls with a distinct ipsilateral to contralateral separation i.e. Dmeanipsicontra>5 Gy. Note: Each matched case-control pair is located in vertical direction.
