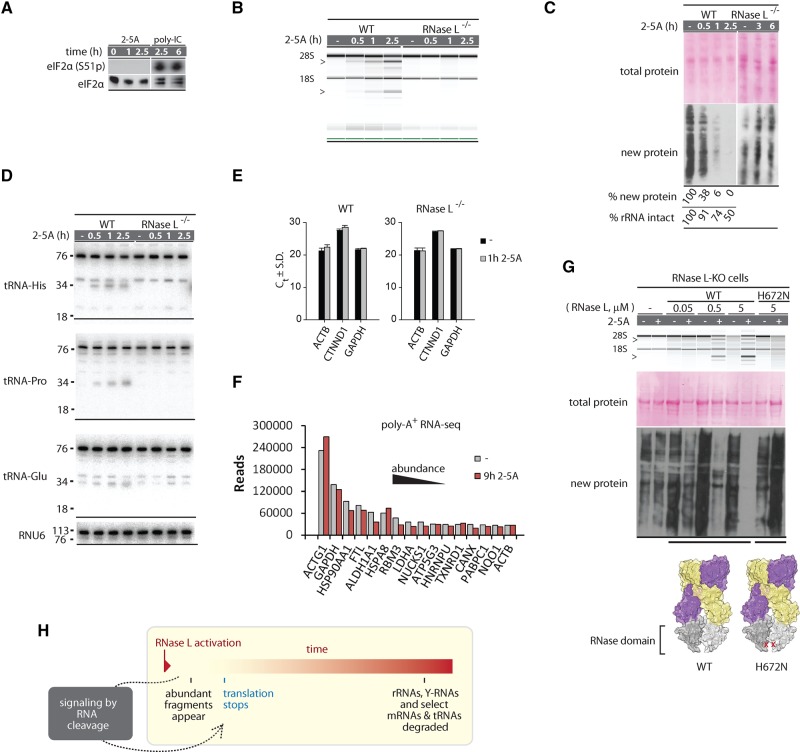
FIGURE 5.
RNA degradation versus translation control by RNase L. (A) Western blot for eIF2α phosphorylation shows absence of strong PKR activation during 2-5A treatment. (B) RNA chip analysis of cellular RNA cleavage during 2-5A treatment. (C) Western blot analysis to detect protein synthesis inhibition by 2-5A. Note that 2-5A does not change the abundance of preexisting proteins, but arrests new protein synthesis. Translation arrest requires RNase L. (D) Northern blot analysis for tRNA cleavage. The expected tRNA halves are observed for tRNA-His and tRNA-Pro, which are sensitive to RNase L. (E) Cellular levels of abundant mRNAs (ACTB1, GAPDH) and an RNase L-sensitive mRNA (CTNND1) (Rath et al. 2015) during 2-5A treatment analyzed by qPCR. Graph shows cycles to threshold (Ct) and SD for two qPCR replicates. (F) RNA-seq quantification of top most abundant mRNAs before and after 2-5A treatment. (G) Transfection of WT, but not the RNase-inactive H672N RNase L (3 h) induces 2-5A-dependent rRNA cleavage and translation block. (H) Proposed model for RNA and translation regulation by RNase L.

