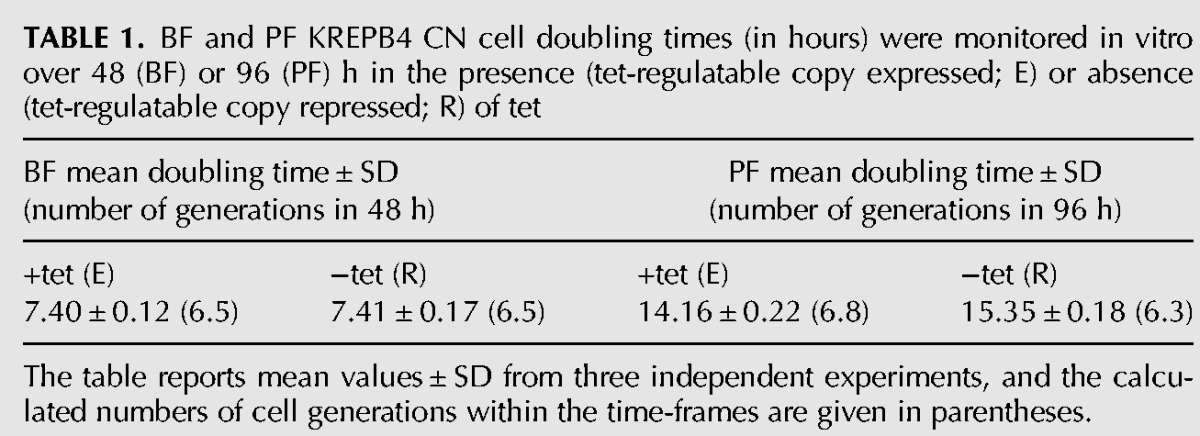
TABLE 1.
BF and PF KREPB4 CN cell doubling times (in hours) were monitored in vitro over 48 (BF) or 96 (PF) h in the presence (tet-regulatable copy expressed; E) or absence (tet-regulatable copy repressed; R) of tet

The table reports mean values ± SD from three independent experiments, and the calculated numbers of cell generations within the time-frames are given in parentheses.
