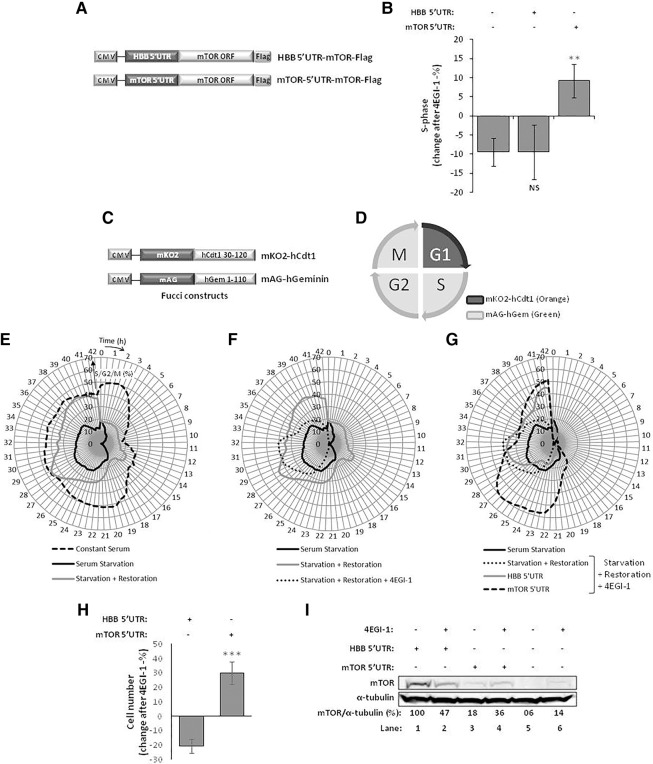
FIGURE 6.
mTOR protein induces cell-cycle progression, when its mRNA its translated through cap-independent translation. (A) Representation of HBB-5′UTR-mTOR-Flag and mTOR-5′UTR-mTOR-Flag plasmid constructs. The 5′UTR of human β-globin (HBB) (5′UTR HBB), or of human mTOR (5′UTR-mTOR), was cloned upstream of the ORF of rat mTOR, which is fused, in the 3′ end, with the Flag-tag encoding sequence. The transcriptional unit expressing mTOR is under the control of CMV promoter. (B–I) Cap-independent translation of mTOR is necessary for its ability to induce cell-cycle progression into S phase. A549 cells were transfected with the HBB 5′UTR or mTOR 5′UTR plasmid constructs and serum deprived for 30 h. Serum was reintroduced and, 4–6 h later, cells were treated with 250 µM 4EGI-1, or DMSO-vehicle for 12 h, or as indicated. In parallel, a subset of control vector-transfected A549 cells was treated similarly. (B) Fluorescence-activated cell sorting (FACS) analyses of 4EGI-1-treated and transfected A549 cells. The y-axis shows the percentage of cells that entered (if positive) or left (if negative) S phase of the cell cycle after treatment with 4EGI-1. Histogram shows mean ± SD from three independent experiments. Statistical analysis was performed using Student's t-test (unpaired, two-tailed); (NS) nonsignificant; (**) P < 0.01 (see also Supplemental Fig. S4). (C) Representation of fucci constructs: mKO2-hCdt1 encodes a monomeric version of Kusabira Orange fluorescent protein gene fused to codons 30–120 of human cdt1, and mAG-hGeminin encodes a monomeric version of Azami Green fluorescent protein gene fused to codons 1–110 of human geminin (Genolet et al. 2011). (D) Representation of the expression of fucci constructs during the different phases of the cell cycle: mKO2-hCdt1 protein is degraded by the SCFSkp2 complex at the onset of S phase and thus is only expressed during G0/G1 phase, and mAG-hGeminin protein is degraded by the APCCdh1 complex during late mitosis and G1 and thus is only expressed during S/G2/M phase. (E–G) A549 cells stably expressing the fucci constructs were treated and transfected as described above, and mKO2-hCdt1 and mAG-hGeminin expression were followed in single cells for 42 h from the moment 4EGI-1 or DMSO was added, using computer-assisted incubator fluorescence microscopy. The radius-axis indicates time after 4EGI-1/DMSO addition (for Restoration conditions this corresponds to 4 h after serum reintroduction) and is presented in hours. The angle-axis indicates the percentage of cells in S/G2/M phase. At least 100 cells were analyzed for each condition and the experiment was repeated three times. Shown are representative data. (H) Cell growth analyses of 4EGI-1-treated and transfected A549 cells. The y-axis shows the percentage increase (if positive) or decrease (if negative) of the total number of cells 42 h after treatment with 4EGI-1. Histogram shows mean ± SD from three independent experiments. Statistical analysis was performed using Student's t-test (unpaired, two-tailed); (NS) nonsignificant; (∗∗∗) P < 0.001. (I) Western blot analysis of transfected and 4EGI-1-treated A549 cell extracts using anti-mTOR antibody. The α-tubulin-specific antibody controls for protein loading. Densitometry measurement of mTOR protein is shown below the autoradiographs (percentage relative to the HBB 5′UTR levels in the control vehicle condition, arbitrarily set to 100%).

