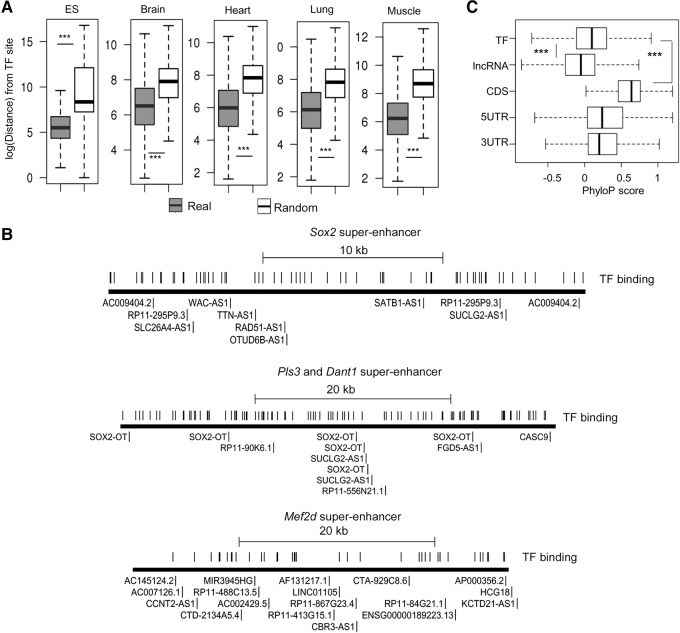
FIGURE 4.
Super-lncRNAs and master transcription factors bind at different locations. (A) Distance between master transcription factor binding sites to their nearest super-lncRNA anchor sites. The y-axis represents the logarithm of the distance between a master transcription factor binding site to its nearest super-lncRNA anchor site. The boxplot marked “real” represents the actual sites, and the one marked as “random” represents the null model. The plots are for five different tissues. Amount of statistical difference is indicated by (***) (P-value < 0.0001). (B) Visual representation of binding sites of super-lncRNAs and master transcription factors in three example super-enhancers associated with Sox2, Pls3/Dant1, and Mef2d. Identification of super-lncRNAs binding to the super-enhancers is also indicated next to the anchor site. (C) PhyloP conservation score at master transcription factor binding site is greater than scores at super-lncRNA binding sites. (TF) Master transcription factor sites; (lncRNA) super-lncRNA binding sites; (CDS) coding regions of protein-coding genes; (5UTR and 3UTR) 5′UTR and 3′UTR regions of protein-coding genes.

