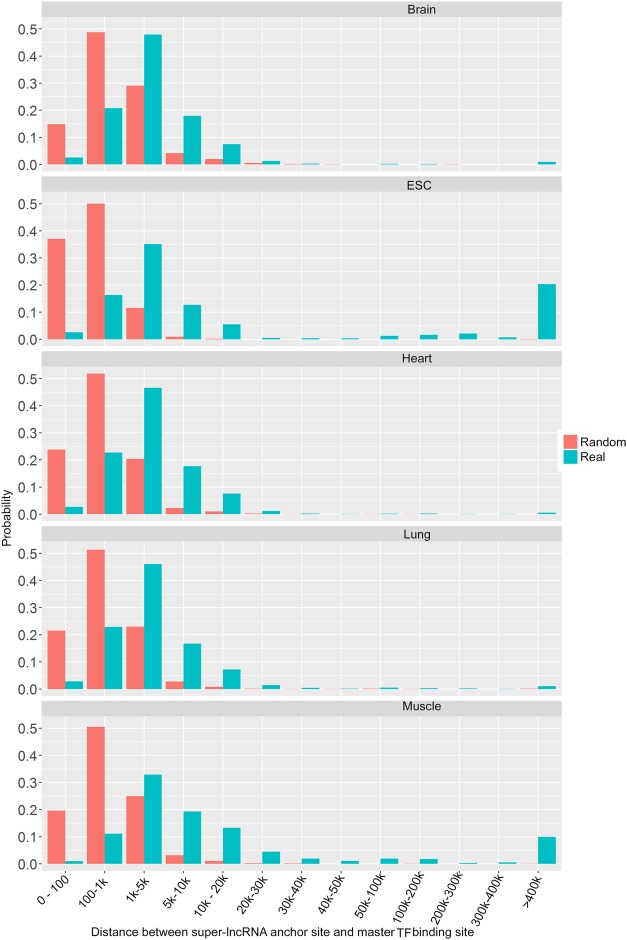
FIGURE 5.
Distance between super-lncRNAs anchor sites and master transcription factors binding sites. The five plots indicate the histograms of the distances between super-lncRNA anchor sites and master transcription factor binding sites in five different cells or tissues (indicated as “Real”). The histogram from the null model is also indicated (marked as “Random”). The x-axis indicates the distance and the y-axis indicates the probability.

