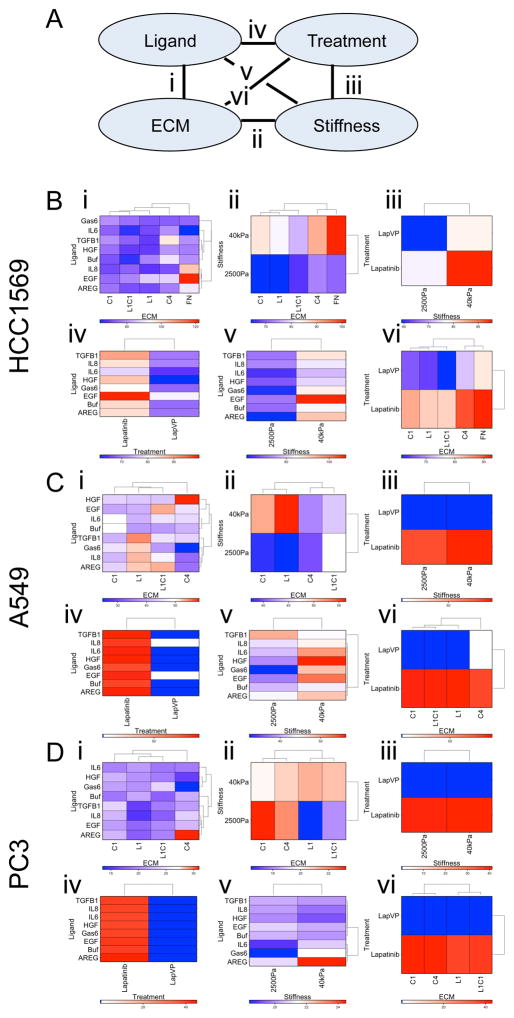
Figure 2. Identification of synergistic interacting microenvironment components.
(A) A diagram showing each of the pair-wise interactions that were tested (i–vi) between individual components of microenvironments. (B–D) Clustered heat maps represent z-scores of EdU-incorporation in all the microenvironments that contain both of the indicated components including: (i) an ECM with a ligand, (ii) stiffness with an ECM, (iii) drug treatment with stiffness, (iv) drug treatment with ligand, (v) stiffness with a ligand, and (vi) drug treatment with an ECM. These pair-wise interactions were tested in (B) HCC1569, (C) A549, and (D) PC3. Each cell line showed resistance (red) or sensitivity (blue) to lapatinib in unique combinations of ECM and soluble ligands (n = 60 for each microenvironment).

