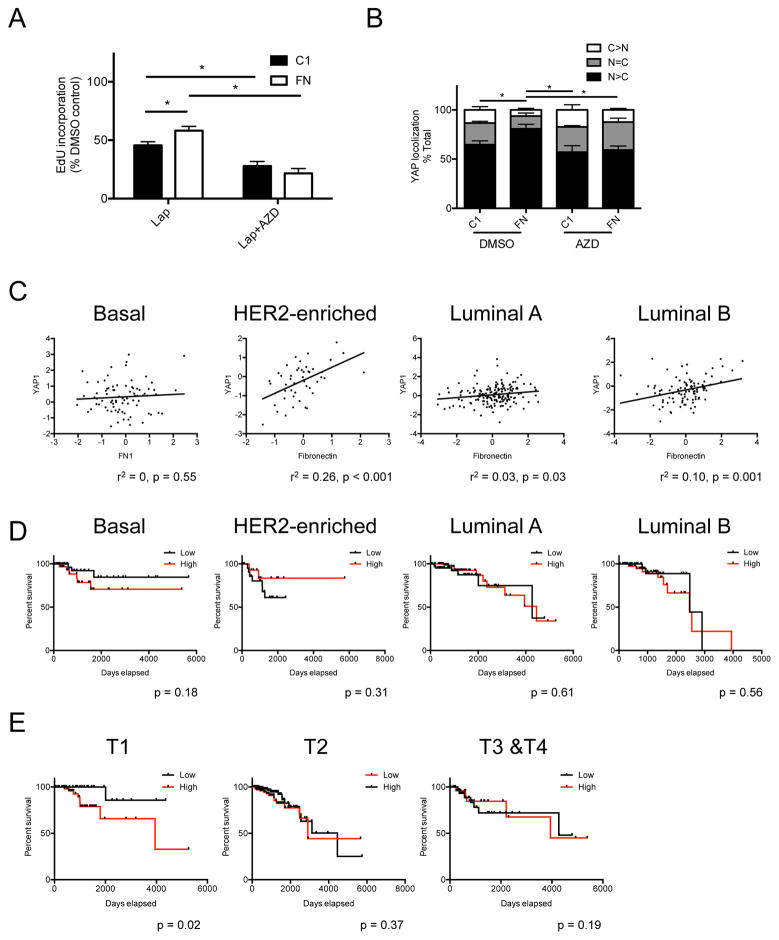
Figure 5. Adhesion to fibronectin increases nuclear YAP translocation and confers lapatinib resistance in HCC1569.
(A) Bar graph represents drug responses of HCC1569 cultured on type I collagen (C1) or fibronectin (FN) coated glass coverslips, and treated with lapatinib or lapatinib plus verteporfin. Data are represented as mean ± SEM (n = 3; 500 cells/condition per experiment). (B) Bar graph represents the distribution of YAP (C>N, higher in cytoplasm; N=C, equally between nucleus and cytoplasm; N>C, higher in nucleus) of HCC1569 cultured on C1 or FN, treated with or without AZD0530. Data are represented as mean ± SEM (n = 3; 100 cells/condition per experiment). (C) Scatter plots represent the correlation of protein levels between fibronectin and YAP in basal, HER2-enriched, luminal A, and luminal-B subtypes of breast cancers. r2 and p value are calculated from Pearson correlation coefficient. (D) Kaplan-Meier plots represent the survival rate affected by protein level of fibronectin in basal, HER2-enriched, luminal A, and luminal-B subtypes of breast cancer. p values are calculated from Log-rank (Mantel-Cox) test. (E) Kaplan-Meier plots represent the survival rate affected by protein level of fibronectin in T1, T2, and T3–T4 pathological stages of breast cancer. p values are calculated from Log-rank (Mantel-Cox) test.

