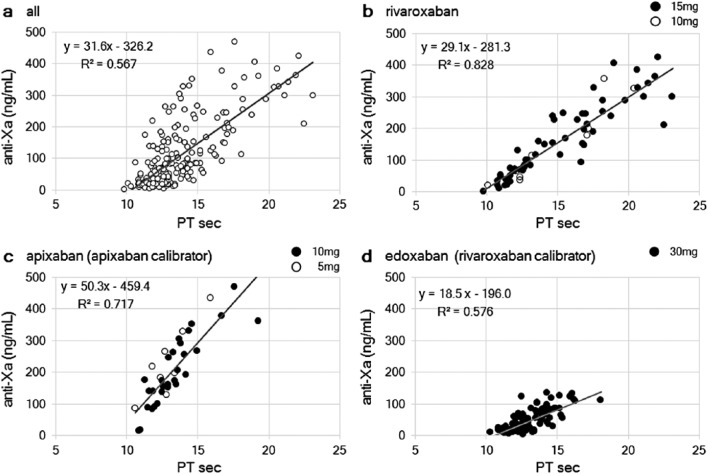
Figure 3.
Plasma anti-Xa activity versus prothrombin time (PT). The relationship between PT and the plasma anti-Xa activity in (a) all samples, (b) rivaroxaban, and (c) apixaban using an apixaban calibrator and (d) edoxaban using a rivaroxaban calibrator is shown. The dosage regimens are indicated by black and white dots. The estimated formula with an exponential approximation and the coefficient of determination (R2) is shown.

