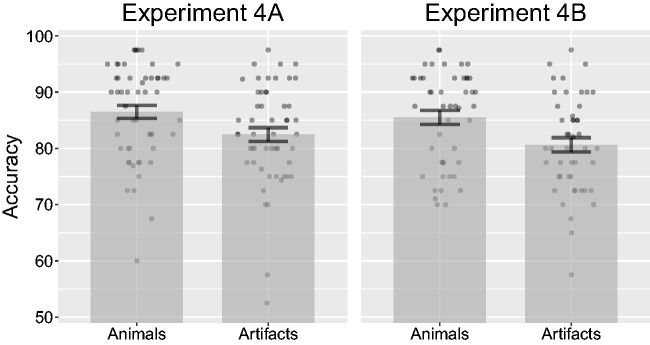
Figure 11.
Combined bar and scatter plots on target accuracy from Experiments 4A and 4B. Error bars show standard error and the superimposed scatterplots show mean values from each participant. Experiment 4A used the same stimuli as in 2A (photographs), while Experiment 4B used the same stimuli as 2B (line drawings).

