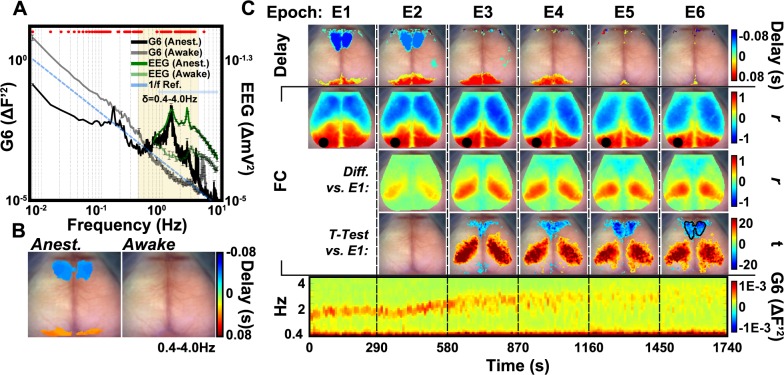
Fig 7. Spontaneous activity in anesthetized and awake mice reveals regional temporal delay structure.
(A) Power spectra from the whole brain from a representative mouse. The presence of a peak at ~1.5Hz in both the anesthetized GCaMP6 (black) and EEG (dark green) corresponds to increased delta band (0.4–4.0Hz) activity observed in the brain under anesthesia and deep, slow-wave sleep (see Introduction). Note that this peak is absent when the mouse is awake (GCaMP6, transparent black, EEG, transparent green). Maximum cross-correlation between the whole brain signal and each pixel’s timeseries were calculated across the FOV. Cortex-wide delay topography may underlie the striking correlated/anti-correlated structure observed in the anesthetized functional connectivity maps due to the effect of phase shifts on the magnitude and sign of zero-lag correlations. Asterisks represent significant (p<0.0001) comparisons across state following two-sample Welch’s t-tests. Error bars are standard error of the mean. (B) Group-wise delay maps in anesthetized (top) and awake (bottom) mice (N = 7). The map from anesthetized mice show a temporal separation along the anterior-posterior axis of the brain, with anterior somatomotor regions leading the whole brain signal by < = 0.06s and posterior visuoparietal areas lagging the whole brain signal by < = 0.06s. This time shift is in agreement with the striking correlated/anti-correlated structure in the delta band functional connectivity maps (see Fig 4). This structure is not present in awake mice. Group-average maps are masked using pixels identified to be significant (p<0.001) following one-sample t-testing. (C) Top: Delay maps from consecutive 300s epochs from one mouse as it transitions out of anesthesia to awake reveals a loss of anterior-posterior delay structure across time. Middle section: functional connectivity maps for a left visual seed from each epoch (top row), difference images between each successive epoch and E1 (middle row), and pixelwise t-statistic maps after performing paired t-tests between E1 and each other epoch (bottom row). The boundary of the area of maximum delay in the anterior, cingulate network in the delay map in E1 (top section of C) is overlaid on the E6 t-statistic map for reference. These data show that the correlation magnitude of the parietal region differs across state and that there is agreement across delay and functional connectivity analyses in the implicated cingulate network. All analysis was performed after dividing each 300s epoch into ten 30s windows. Bottom: Spectrogram over the delta frequency band (0.4–4.0Hz) from each epoch showing the loss of delta-band activity (peak at ~1.5Hz) with time across epochs.

