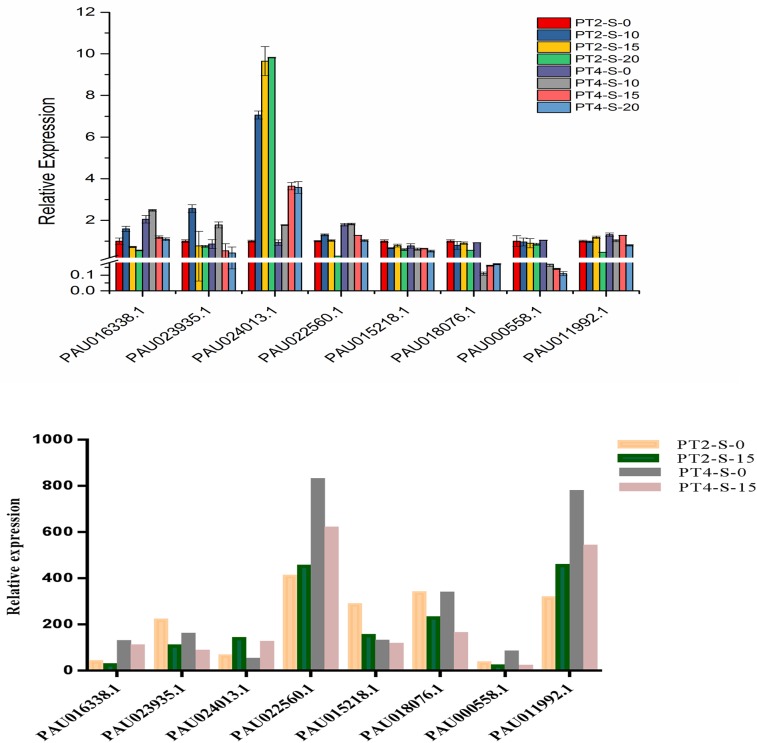
Fig 8. Expression pattern confirmation of selected genes by qRT-PCR.
(A) Quantitative Real-Time PCR (qRT-PCR) analysis of 8 selected differentially expressed genes. 18S rRNA was used as the internal reference gene. For each group, the PT2 (S-0) expressed level was considered as 1.00, and other samples were normalized accordingly. Standard error of the mean for three technical replicates is represented by the error bars. S-0, S-10, S-15, and S-20 (0, 10, 15, and 20 days), 0.4% NaCl salt-treated for PT2 and PT4, respectively. (B) Changes in the relative expression levels of 8 selected genes as determined by RNA-Seq.

