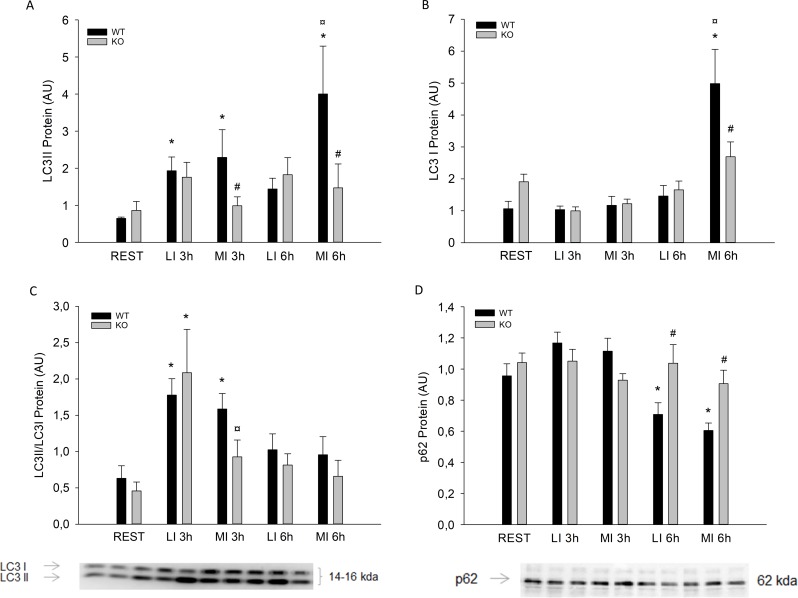
Fig 3.
A) LC3II B) LC3I protein content, C) LC3II/LC3I Ratio and D) P62 protein content from PGC-1α knockout (KO) and littermate wildtype (WT) control mice at rest (REST), 3h and 6h after a single treadmill exercise bout at either low intensity (LI) or moderate intensity (MI). Values are mean ±SE, n = 8. *Significantly different from REST within given genotype (p<0.05). ¤ Significantly different from LI within given genotype (p<0.05). # Significantly different from WT within given group (p<0.05).

