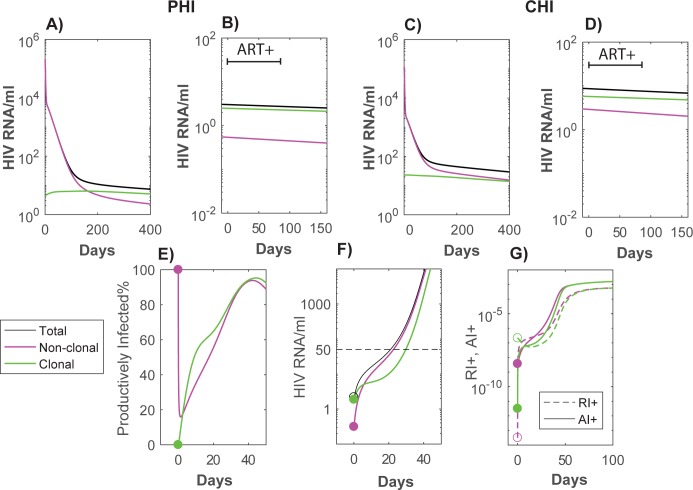
Fig 4.
pVL simulations with ART (A and C), and treatment intensification after 3 years of ART (B and D). Panels A and B describe contributions to pVL for ART commenced at PHI, while C and D describe pVL commenced at CHI. pVL: total (black), arising from cells directly infected by virus (magenta), and from infected cells that were produced via homeostatic proliferation (through processes within the R+ component) from cells with integrated HIV DNA (green). In the treatment intensification panels B) and D), time has been reset to commencement of 12 weeks ART intensification (an integrase inhibitor with efficacy 99.9% is assumed added to a nonRAL regimen which had the same overall efficacy as in Fig 3 simulations), followed by reversion to the original ART regimen at day 84. E), F), G) Rebound of pVL after stopping 6 years of ART. Here we track the origin of the resulting viremia and cellular infection both in terms of whether the infected cell arose through clonal expansion or not, and whether the cells are in the activated dividing or resting dividing infected phenotype. E) Percentage of productively infected cells (A I+) of all virus producing cells (A I+ + R I+) separated into clonal (green) or direct infection (magenta) origin. Prior to interruption almost all cells producing virus are productively infected if they originally arose from direct infection, whereas if the cells arose from clonal expansion they are mostly in the resting dividing subset (R I+). Soon after interruption the majority of cells are productively infected regardless of their original infection type. F) Source of rebounding viremia by original infection type–this also tracks subsequent generations of new infection relative to these subsets. G) Expansion of virus producing cells (A I+, R I+) relative to their source of infection–as depicted in panel E) infection is mostly in the productive infected subset (A I+) regardless of the original source of infection.

