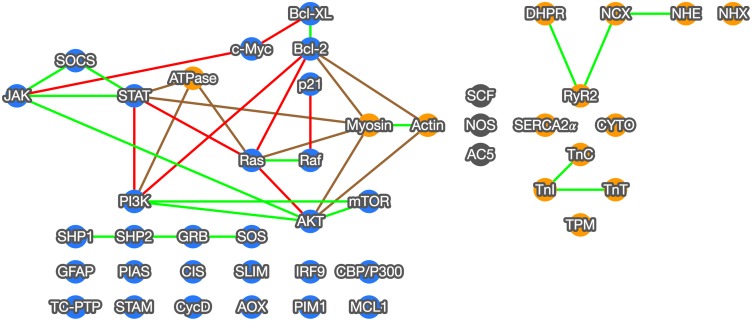
Fig 10. Consensus network output.
Mining genetic information from abstracts cited within PubMed, our method generated a consensus network using large numbers of Bayesian networks representing potential genetic interactions within the JAK-STAT signaling (blue nodes) and Cardiac Muscle Contraction (orange nodes) KEGG pathways. Gray nodes are randomly selected negative controls. This graph shows the consensus network at a resolution of 0.9. Edges between genes indicate an inferred relationship. Green lines indicate a conserved interaction between the consensus network and the KEGG pathway, red lines indicate a novel interaction within the pathway, and brown lines indicate pathway-pathway interactions.

