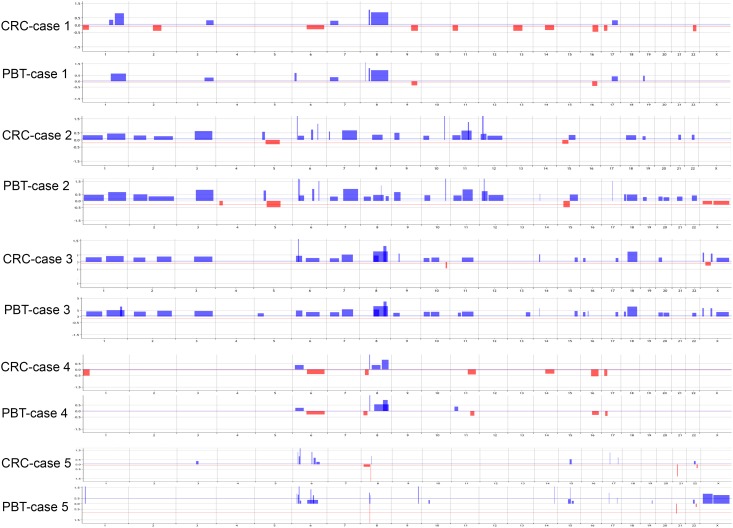
Fig 2. Genomic profile plots of the CRCs and corresponding original PBT of five cases analyzed.
Vertical lines represent chromosome numbers and blue and red peaks cytobands with gains/amplifications and loss/deletions, respectively. Plots obtained from Agilent Cytogenomics v.2.9.2.4, using the algorithm ADM2 and the threshold value of 6.0.

