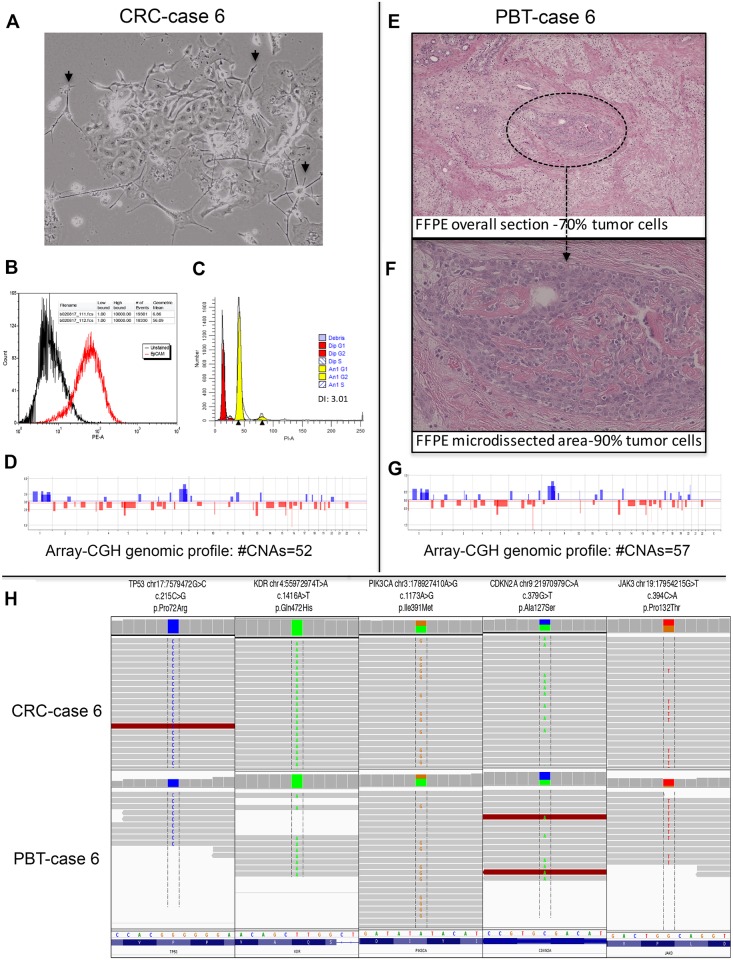
Fig 3. Primary breast tumor (PBT) and corresponding CRC of case 6, representative of the TNBC subtype.
A: Phase contrast image of CRC co-culture, showing the feeder cells (short arrows) and an epithelial cell colony (cobblestone cell morphology) (40x); B: Flow cytometry histogram showing CRC cells stained for PE/CD326 (EpCAM) (red peaks); unlabeled control (black peaks). Number of gated cells >10,000; C: Ploidy analysis showing a DNA index of 3.01(G1 aneuploidy yellow peak) in relation to the diploid control (Peripheral Blood Lymphocyte (PBL)—G1 diploid red peak); E: FFPE tissue section (40x) and F: tumor area microdissected for the molecular analysis (400x); D and G: Genomic profile plots of the PBT and corresponding CRC, respectively; H. Next generation sequencing analysis of CRCs and corresponding PBTs showing the retention of specific somatic variants on the TP53, KDR, PIK3CA, CDKN2 and JAK3 genes in the CRCs.

