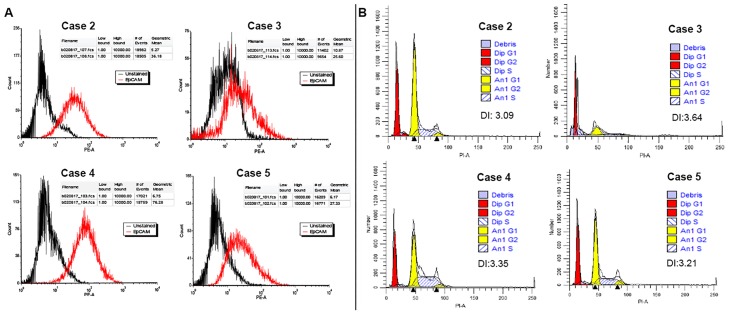
Fig 4.
A. Flow cytometry histogram of CRCs from cases 2–5, showing CRC cells stained for PE/CD326 (EpCAM) (red peaks); unlabeled control (black peaks). Number of gated cells >10,000. B. Ploidy plots and corresponding DNA index of the CRCs (G1 aneuploidy yellow peak) in relation to the diploid control (Peripheral Blood Lymphocyte (PBL)—G1 diploid red peak) (FACSAria system).

