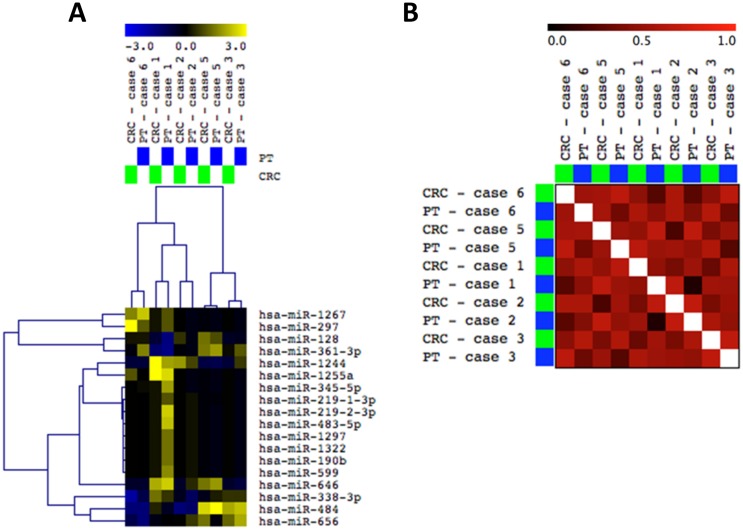
Fig 5. Global miRNA profiling of five pairs of CRCs and corresponding PBTs.
A: Supervised Hierarchical Clustering (SHC) analysis (Pearson Correlation, Anova P<0.05) showing close clustering for most of the paired cases based on 18 miRNAs differentially expressed (miRNAs up-and down-regulated in yellow and blue colors, respectively). B: Gene Distance Matrix (GDM) correlation analysis, respectively (MeV 4.9.0).

