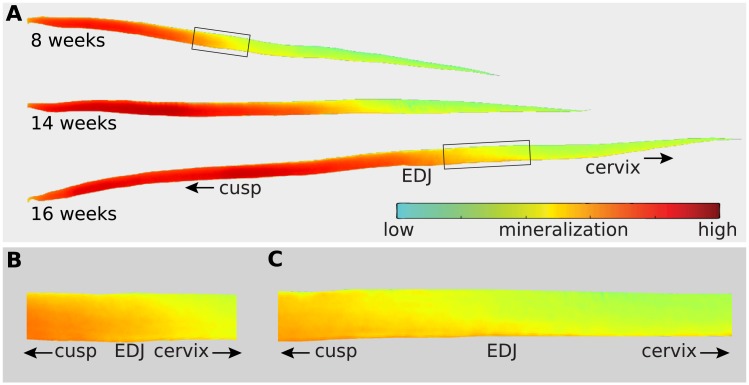
Fig 3. High-resolution (13μm) synchrotron scans of developing teeth reveal detailed density patterns.
(A) Virtually dissected enamel crowns from molar scans of sheep that died at 8, 14 and 16 weeks of age. The gradient from red to green represent more to less HAp density, respectively. (B) Detail of maturation onset for the 8 week-old molar. (C) Detail of maturation onset for the 16 week-old molar, showing a more acute maturation geometry (orange and red boundary), with a highly mineralized innermost enamel layer leading in a cervical direction.

