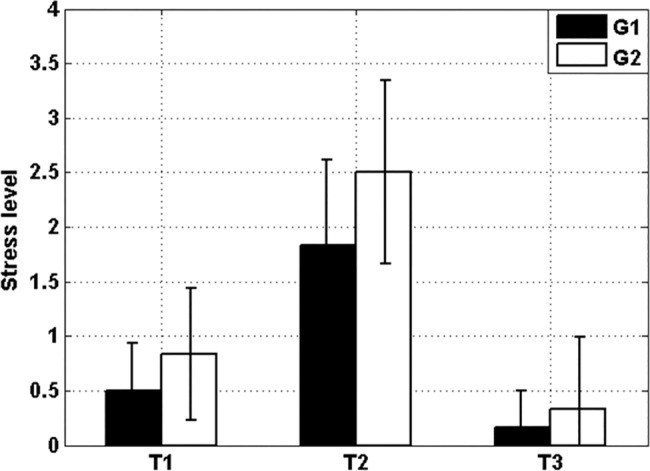
Fig 3. Mean (bars) and SEM (errorbars) of the subjective self-perceived stress level.

G1 (black) and G2 (white). At each time (T1, T2 and T3) there was no significant inter-group difference. The intra-group analysis reveals significant differences of subjective stress level T1-T2 and T2-T3 for both groups. The latter proves that both the stress and relaxation sessions were satisfactory completed.
