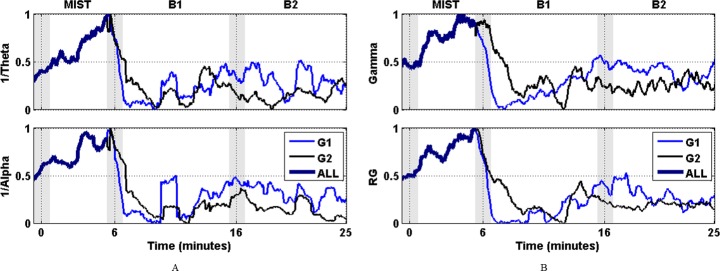
Fig 4. Normalized mean spectral power of G1 (blue) and G2 (black).
Shaded bars indicate transition time intervals due to smoothing and interpolation. (A) Gamma power on the top and the RG at the bottom. (B) 1/Theta power on the top and 1/Alpha power at the bottom. The four plots show that despite they exhibit a high level of correlation and similar envelope, the RG computes a smoother version that emphasizes the differences of curves of G1 and G2 during the transition to B1.

