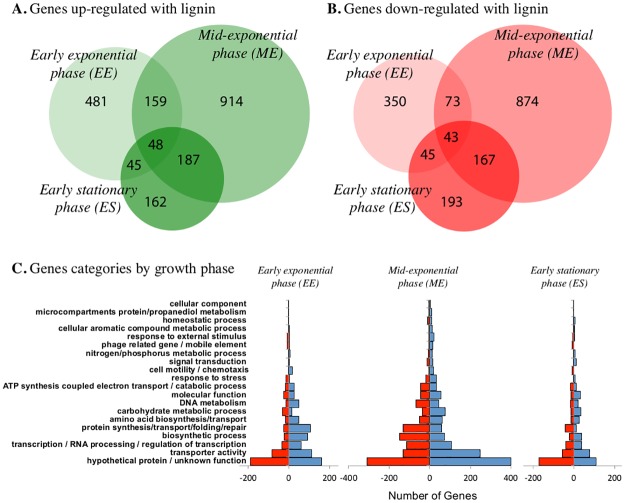
Fig 2.
Venn diagrams of differentially expressed genes, where (A) green circles indicate number of total genes are up-regulated each time point, and (B) red circles indicate number of total genes were down-regulated each time point. EE indicates cells analyzed in early exponential phase, ME, mid-exponential phase and ES, early stationary phase, where actual times of sampling each cell population is indicated in the methods as well as in Fig 1A. (C) Changes in the gene profile as a result of lignin exposure in early exponential phase, mid-exponential and early stationary phase of growth. In the right side of each chart (blue), number of genes with increased relative abundance, and in the left side (red), number of genes with lower relative abundance. The genes are grouped according to functional class as defined by COG annotation.

