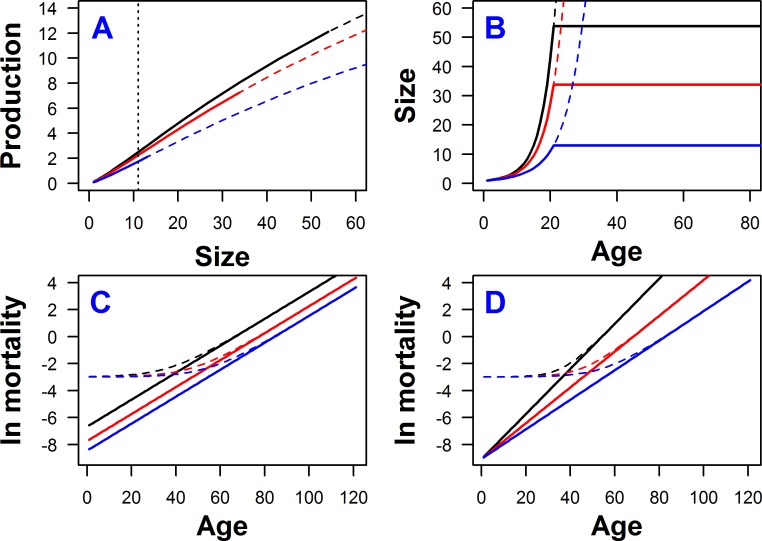
Fig 1. Model assumptions.
(A) Production rate as a function of body size for three different age-independent effects of DD on production rate: black lines–no effect of DD (Qψ = 1), red lines–moderate DD (Qψ = 0.9), blue lines–strong DD (Qψ = 0.7). Dashed lines represent the production rate expected if an organism would continue to grow rather than mature. Solid lines represent a part of the production curve that is experienced by an organism maturing at age 20. The ends of the solid lines determine adult size and thus fertility rate. The vertical dotted black line denotes the body size at the inflection point, which is common for all three curves. (B) Growth trajectory as a function of age. Colors have the same meaning as in (A). Dashed lines represent the projection of growth trajectories if maturity would not occur. The panels (A) and (B) can also represent the case when there is no DD acting on production rate and different colors indicate different fractions of resources allocated to repairs; black: z = 0, red: z = 0.1, blue: z = 0.3. (C) Mortality as a function of age under the proportional hazard model (PHM); black lines: fraction of resources allocated to repairs z = 0.1; red lines: z = 0.2, blue lines: z = 0.3; solid lines: no extrinsic mortality c = 0, dashed lines: c = 0.05; other parameters in Eq (5) were set to a1 = –1, b1 = 0.1, and u1 = –10. (D) The same as in (C), but under senescence slowing model (SSM); parameters of Eq (6) set to a2 = –9, b2 = 0.35, and u2 = 0.325.

