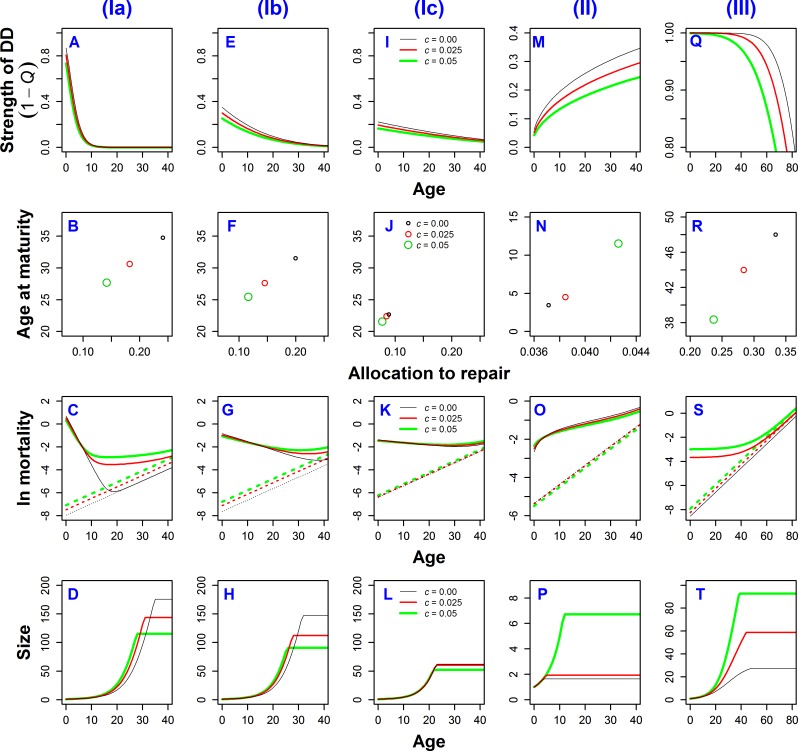
Fig 5. ESS life histories for three different cases of age-specific density-dependence.
(I) DD acting on survival with strength decreasing with age, (II) DD acting on survival with strength increasing with age, (III) DD acting on production rate with strength decreasing with age. All cases calculated for PHM, with parameters b1 = 0.1, and K = 4. Strength of DD was calculated as 1–Q, where Q (QS or Qψ) is defined in Eq (11). See also S3 File for mathematical definitions and parameters for used shapes of DD.

