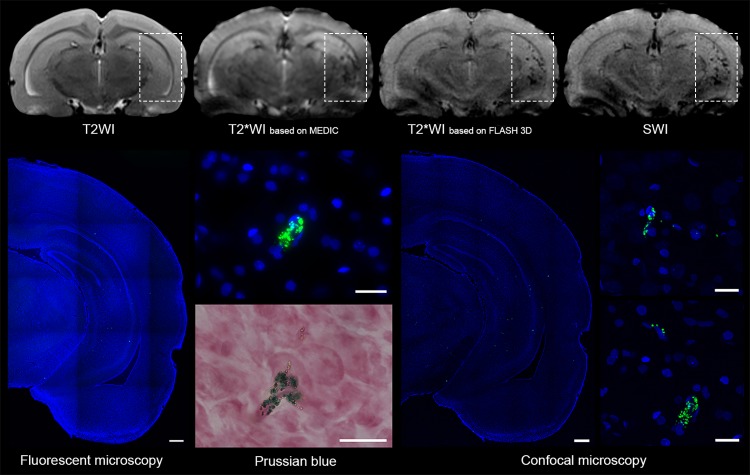
Fig 6. MR and histological images of a rat brain taken after intra-arterial administration of 5x10⁵ hMSCs labeled with MC03F microparticles via the right internal carotid artery.
MRI was performed immediately after cell transplantation and euthanasia–immediately after MRI. Top panel row, left to right: T2WI, T2*WI based on MEDIC, T2*WI based on FLASH 3D, and SWI images. Rectangles indicate the area of labeled cells distribution. Bottom panel, left to right: conventional fluorescence microscopy (low and high magnification), bright-field microscopy of Perls’ Prussian Blue stained sections, confocal fluorescence microscopy (low and high magnification). The scale bars in panoramic views of coronal sections represent 500 μm and at high-magnification pictures they correspond to 50 μm.

