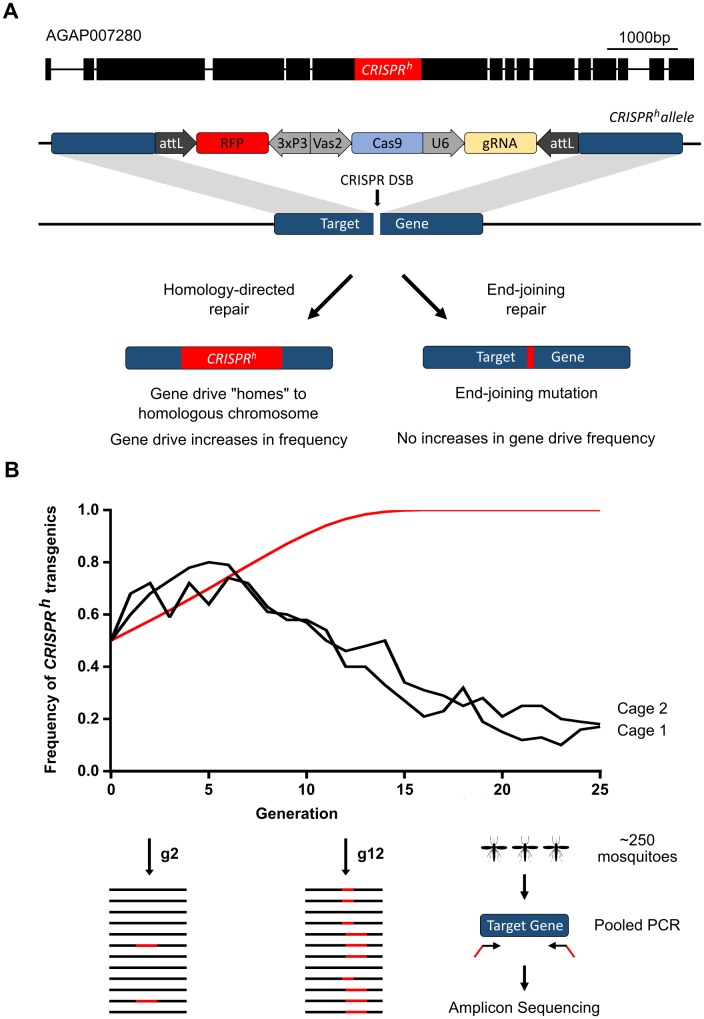
Fig 1. Dynamics of a population suppression gene drive construct over 25 generations.
(A) Design of the CRISPR-based gene drive construct and the relevant position of its target site within AGAP007280; (B) The proportion of individuals containing at least one copy of the gene drive in two replicate cages, monitored each generation for 25 generations. Black lines represent the observed frequencies in each of the two cage trials (CT1 and CT2), red line represents the predicted frequency according to the previous deterministic model that did not take into account target site resistance [11]. Samples were taken for pooled PCR and sequencing analysis of the gene drive target site at G2 and at G12, whereby frequency of target site indels (shown figuratively as red bars) were revealed by their relative representation among the sequenced reads.

