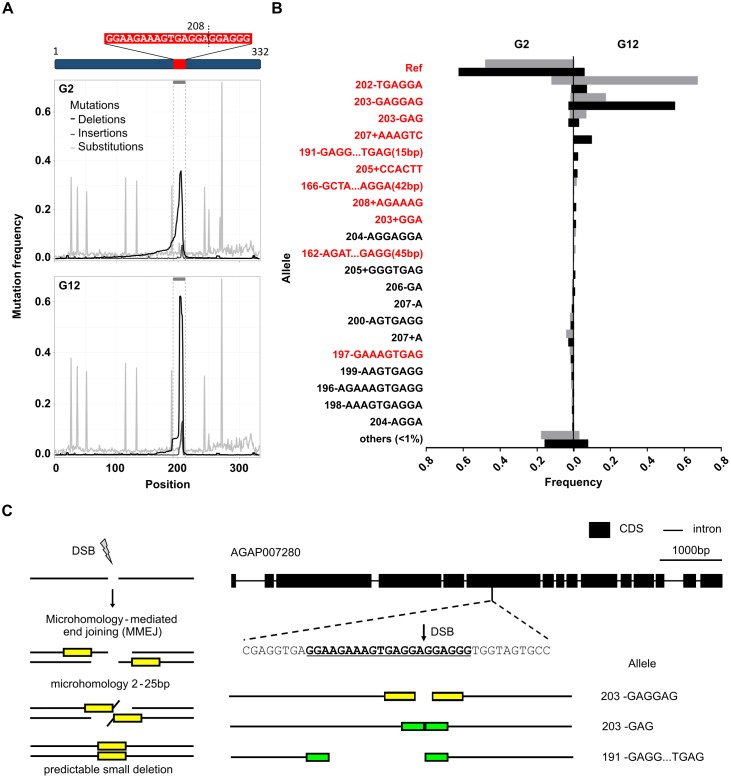
Fig 2. Nuclease-generated target site mutations show selection over time.
(A) Location of the target site of the CRISPR-based gene drive relative to the region amplified for pooled sequencing (highlighted in red), with the double stranded break occurring after nucleotide 208. Cumulative frequencies of deletions (black), insertions (dark grey) and substitutions (light grey) at each nucleotide position along the amplicon were plotted. Numerous substitutions outside of the target site represent SNPs circulating in the lab strain of mosquito in which the gene drive was introduced and were used for analysis of haplotypes of target site mutations (S1 Fig). One cage trial (CT1) shown as a representative example. (B) Frequency of individual target site alleles in both G2 and G12 for cage 1 (black) and cage 2 (grey) with in-frame indels highlighted in red. All alleles never exceeding 1% frequency in at least one condition were grouped together as one class (<1%). (C) Microhomologies flanking the double stranded break at the target could explain some of the most frequent deletions observed. Microhomologies of GAGG (yellow) or GGA (green) and the resultant deletion alleles arising in the event of MMEJ are shown.

