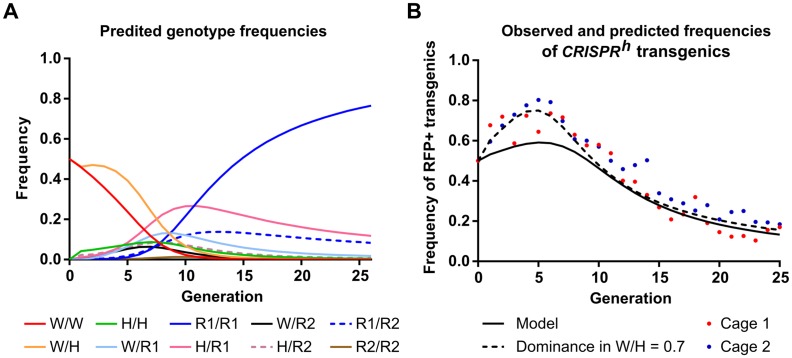
Fig 4. Comparison of observed data with model predicting frequencies of gene drive and resistance alleles.
(A) Expected genotype frequencies according to the model described in the text and considering the four following target site alleles: wild type (w), CRISPRh gene drive (h), resistant and in-frame (r1), resistant and out of frame (r2). We used our best experimental estimates of the considered parameters: homing rate (e) as 0.984, the dominance of the fertility effect due to leaky somatic expression in females heterozygous (w/h) for the gene drive as 0.907, meiotic end-joining rate (γm) as 0.01, embryonic end-joining rate (γe) as 0.796. (B) Our observed gene drive frequencies were compared against model predictions using our best experimental estimates (solid black line) and using the best-fit value (0.70 cf 0.907) for dominance of the heterozygous fertility effect in females (dashed black line).

