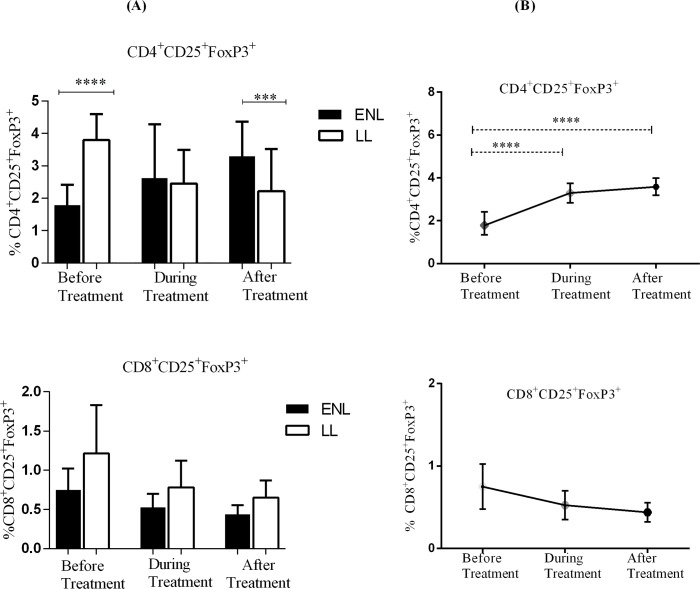
Fig 7.
Median percentage of CD4+ and CD8+ T-cells expressing CD25+ FoxP3+ double positives: (A) in patients with ENL and LL controls before, during and after treatment, (B) within ENL patients before, during and after treatment. * P≤0.05; *** P< 0.001; **** P< 0.0001. Box and whiskers (A) and Error bars (B) show median ± interquartile range.

