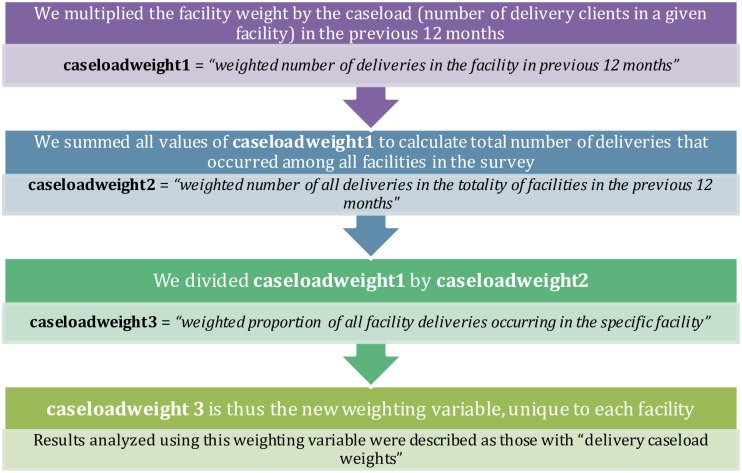
Fig 2. Delivery caseload weight calculation procedure for each facility.
Each step in the chart signifies a separate mathematical step, ultimately showing how one can incorporate delivery caseload into survey weight values. A worked example is found in S1 Table.

