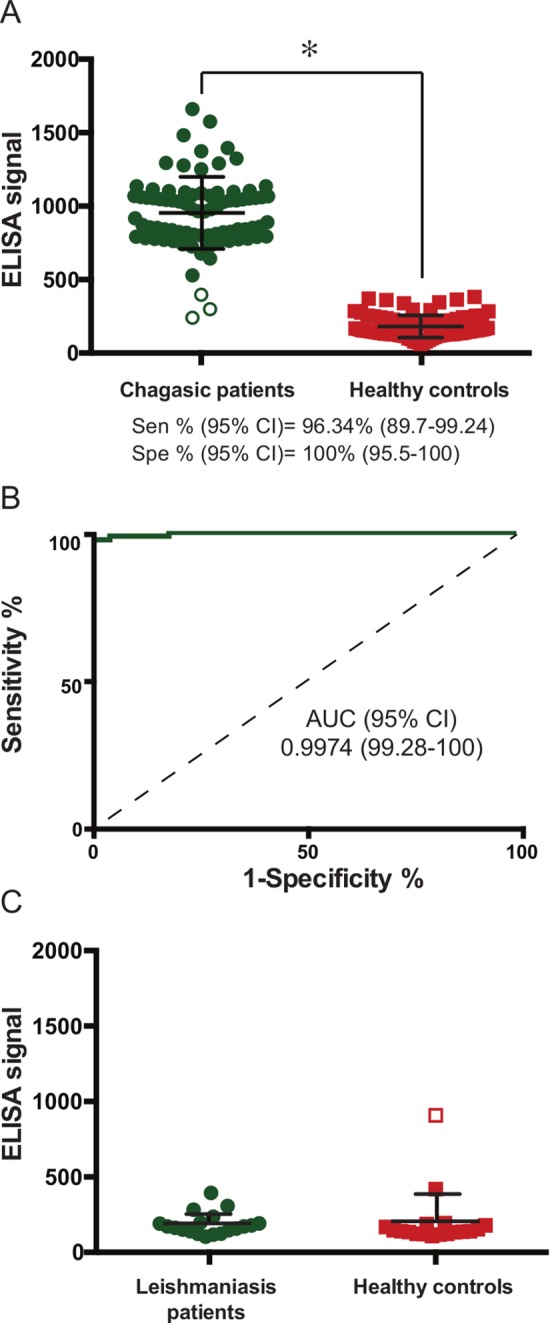
Fig 3. Diagnostic performance of the final multiepitope formulation.

A) Scatter plot showing the distribution of ELISA raw signal obtained from sera samples of Chagas-positive (green circles) and healthy subjects (red squares). Statistical significance (*) p<0.0001, Mann-Whitney test. Green empty circles in the left scatter plot represent those within 3 standard deviations of the average signal of healthy controls. B) Receiver Operating Characteristic curve and statistics for the analysis. C) Scatter plot showing the distribution of ELISA raw signal obtained from Leishmaniasis-positive (green cirles) and Leishmaniasis-negative subjects from the same co-endemic region (red squares). Empty circles represent data points that fall at >3 SD from their respective distributions.
