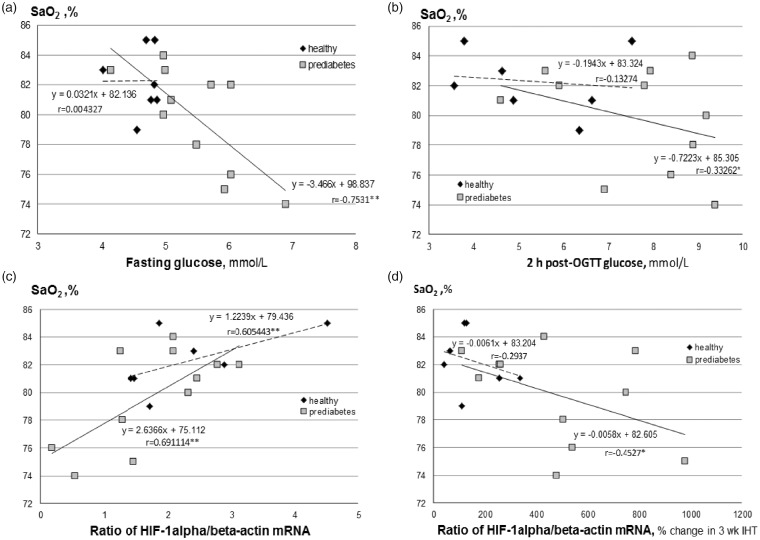
Figure 2.
Relationships between baseline SaO2 at 20th minute of acute hypoxic test (AHT, breathing with 12% of oxygen) and baseline fasting glucose (a), baseline 2 h post-OGTT glucose (b), baseline mRNA expression of HIF-1α (c), and % changes in mRNA expression of HIF-1α between the pre-IHT baseline and post-IHT values (d). HIF: hypoxia inducible factor; OGTT: oral glucose tolerance test. Symbols of correlation coefficient (*P < 0.05 or **P < 0.01) indicate a significant degree of linear relationship between the variables

