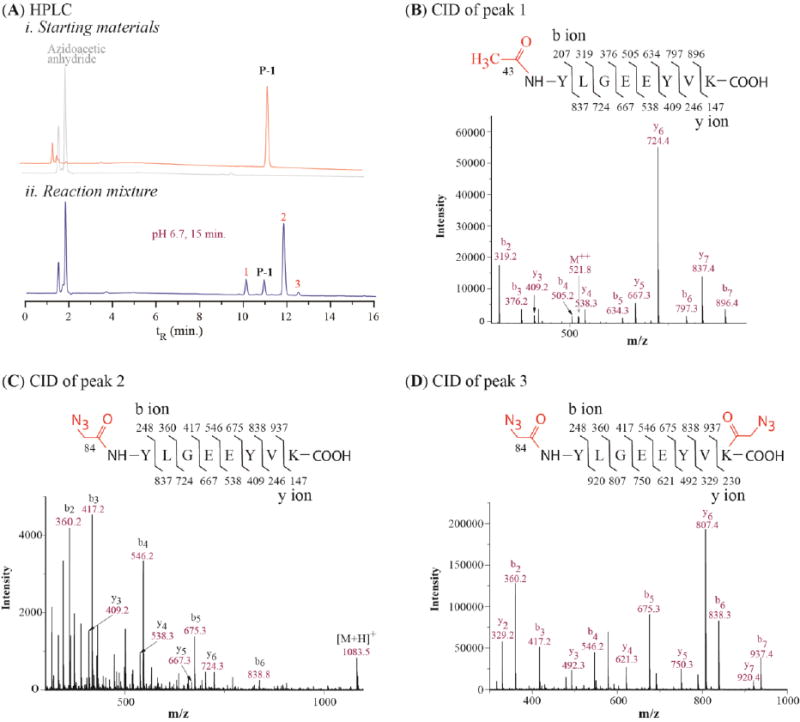
Figure 1.

HPLC and Mass analysis of azidoacetic anhydride reacting with P-1: (A) RP HPLC chromatograms of (i) starting materials and (ii) the reaction mixture at pH 6.7; (B) Tandem mass spectrum of peak 1 in (A); (C) Tandem mass spectrum of peak 2 in (A); (D) Tandem mass spectrum of peak 3 in (A); Inserts in B, C, and D are calculated fragment ions of the corresponding peptides. See Table S1 in Supporting Information for detailed analysis of tandem mass data from collisional-induced dissociation (CID)
