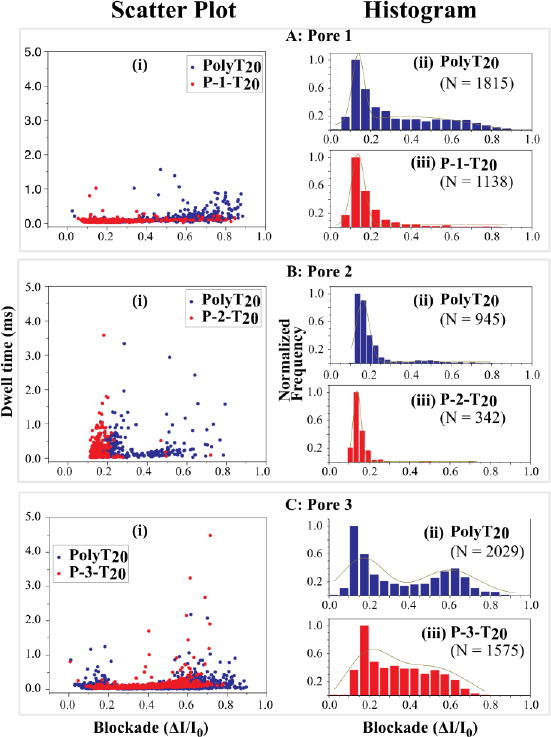
Figure 5.

Scatter-plot of dwell time vs current blockade (i) and histograms of fractional current blockades for PolyT20 (ii) and its peptide conjugates (iii) at bias = 500 mV). (A) Translocation through Pore 1; (B) Translocation through Pore 2; (C) Translocation through Pore 3. Blue: PolyT20, Red: peptide conjugate; ΔI = I0 (open pore current) – I (blocked pore current). The dark yellow lines in histograms are the Gaussian fitting curves and N = number of events.
