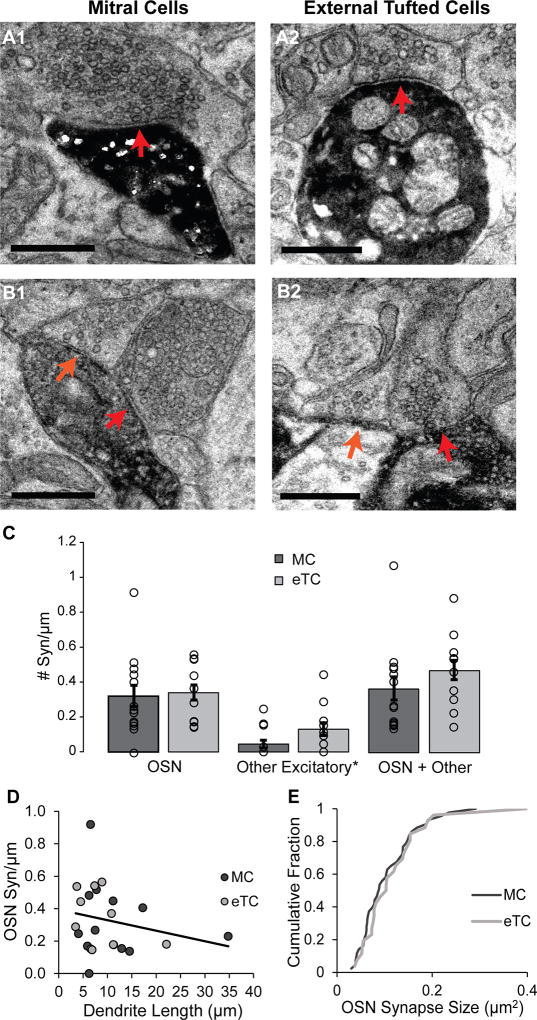
Figure 2. MC and eTC dendrites have similar densities of OSN synapses.
A. Examples of OSN synapses onto a MC (A1; red arrow) and eTC (A2), as characterized by docked synaptic vesicles at the presynaptic membrane and the relatively dark appearance of the axon terminal. Scale bar = 0.5 µm. B. Unidentified putative excitatory axons (orange arrows) synapse on MCs (B1) and eTCs (B2) next to OSN synapses (red arrows). For the eTC example, the DAB-labeled dendrite extends across the bottom of the image. In the imaged plane, the lighter colored region is a mitochondrion within the dendrite. Scale bar = 0.5 µm. C. MC and eTC dendrites have similar densities of both OSN synapses (right), as well as unidentified, putative excitatory axonal synapses (middle). Histogram bars reflect mean values (±SE); density estimates from each analyzed dendritic segment are also overlaid. Asterisk on “Excitatory” emphasizes putative assignment. D. Estimates of OSN synapse densities were independent of the length of the dendritic segments analyzed. R2 = 0.05. E. No difference was also observed in the distributions of OSN synapse size between MCs and eTCs.

