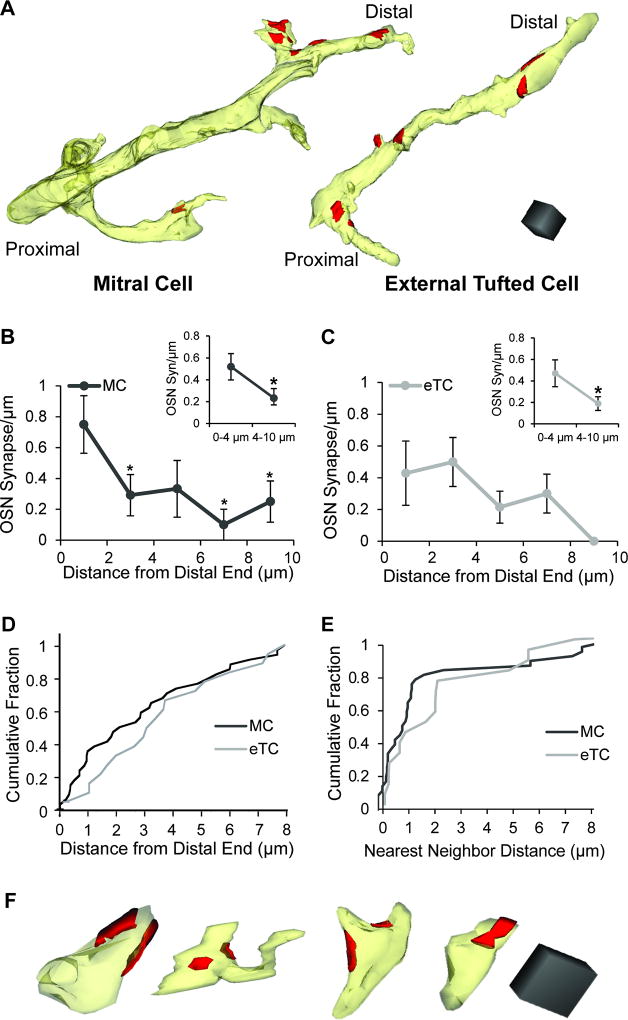
Figure 3. Spatial distribution of OSN synapses on MC and eTC dendrites.
A. Reconstructions of a MC and eTC dendrite showing the distribution of OSN synapses (red). Scale cube = 1 µm3. In these examples, there were no other types of synapses identified. B. On MC dendrites, the density of OSN synapses was higher at the distal-most 2 µm of the segments versus more proximal regions. Asterisks reflect significant differences (p < 0.05) in OSN synapse densities in the indicated intervals versus 0–2 µm (in pair-wise tests following an ANOVA). This pattern was also observed when the intervals were grouped together (inset; *p < 0.05). C. OSN synapse density did not significantly vary along eTC dendrites when analyzed in 2-µm intervals, but a distal preference was observed when intervals were grouped together (inset; *p < 0.05). D. Cumulative distributions of OSN synapse distances from the distal ends of dendritic segments. The MC and eTC distributions were quite similar (K–S; p = 0.46). E. Cumulative distributions of distances between nearest neighboring OSN synapses for MCs and eTCs. Note the large number of closely-spaced OSN synapses on MCs, suggestive of clustering. F. Reconstructions of terminal ends of MC dendrites, all of which have OSN synapses (red) within 0.5 µm of the tip. Scale cube = 0.125 µm3.

