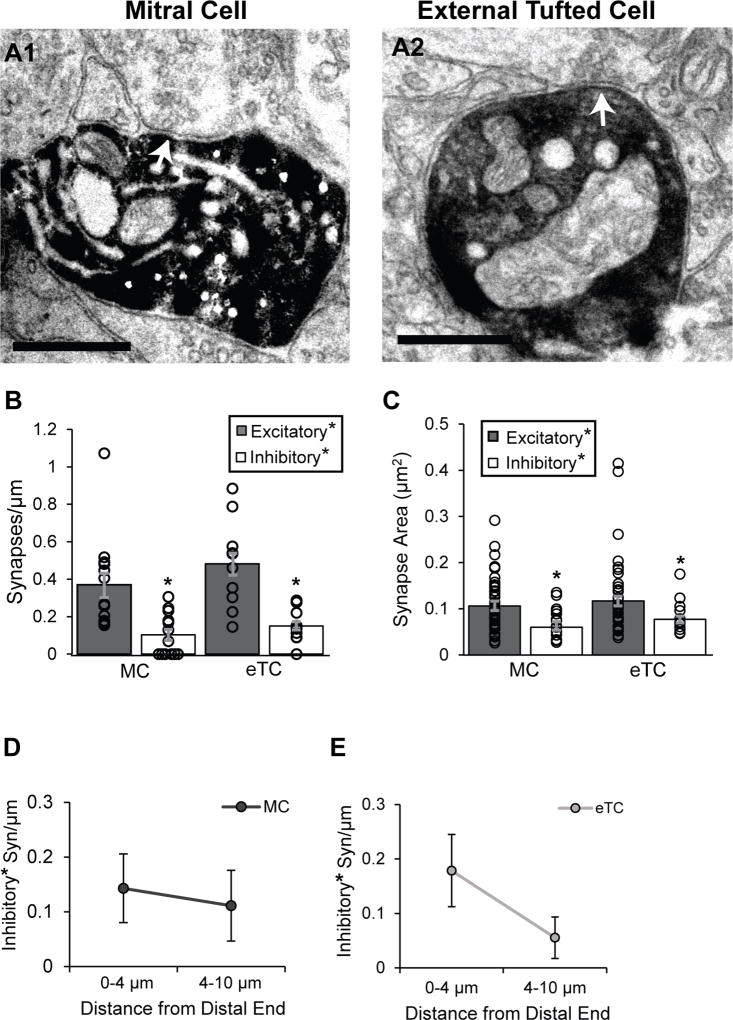
Figure 4. Analysis of putative inhibitory synapses on MCs and eTCs.
A. Electron micrographs of putative inhibitory dendrodendritic synapses onto a DAB-labeled MC (A1; white arrow) and eTC (A2). Note the vesicles that appear to be docked at the presynaptic membranes. In these examples, the presynaptic processes were followed to confirm that they formed a symmetric (inhibitory) synapse on an unlabeled dendrite (not shown). Scale bar = 0.5 µm. B. In both MCs and eTCs, putative inhibitory synapses (dendrodendritic plus axonal) were much fewer in number than putative excitatory synapses (*p < 0.05; all types). At the same time, the two cell-types displayed similar densities of putative inhibitory synapses. Histogram bars reflect mean values (±SE); density estimates from each analyzed dendrite are also shown overlaid. Asterisks on “Excitatory” and “Inhibitory” emphasize putative assignments. C. Putative inhibitory synapses were significantly smaller in size versus putative excitatory synapses on both cell types (*p < 0.05). D,E. The distribution of putative inhibitory synapses on MCs (D) and eTCs (E) dendrites did not significantly vary with distance from the distal end.

