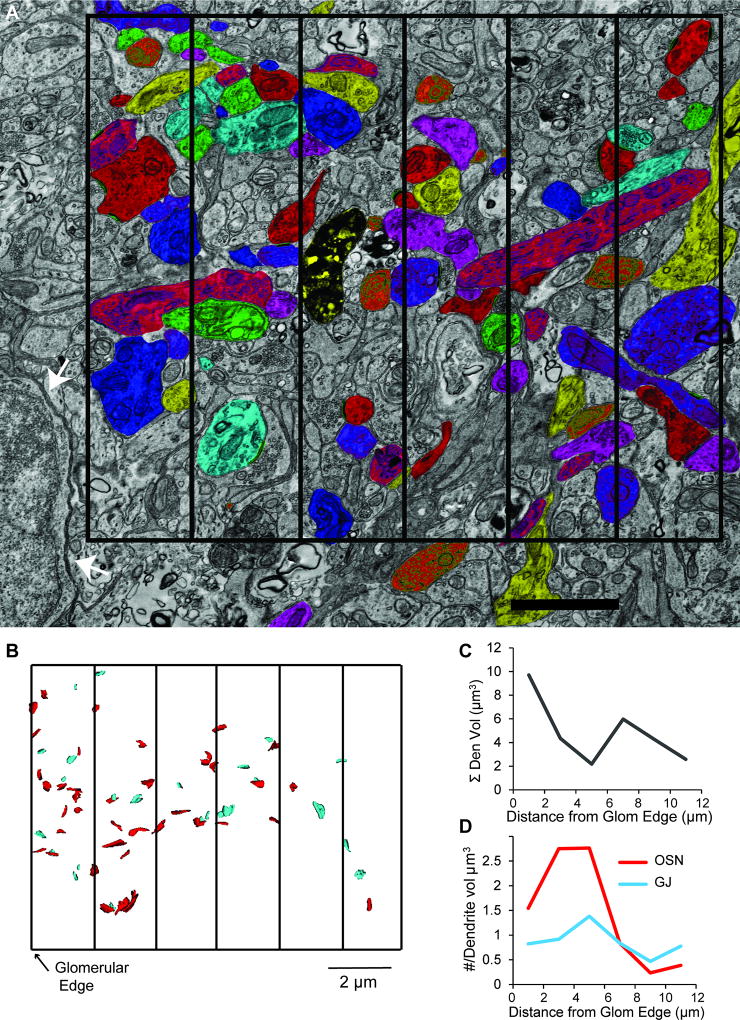
Figure 7. OSN synapse density decreases with distance from the glomerular edge.
A. Electron micrograph with a subset of traced dendrites in the glomerular neuropil. The cell bodies of juxtaglomerular cells (example at white arrows) defined the outer edge of the glomerulus. Images were analyzed in 2 × 10 × 2 µm rectangular cuboids. A two-dimensional 12 × 10 µm grid divided into six sections is superimposed, with the left-most vertical line reflecting the edge of the glomerulus. Scale bar = 2 µm B. Reconstruction of OSN synapses (red) and gap junctions (teal) from putative MC dendrites across the six rectangular cuboids. C. The summed volume of analyzed dendritic segments within each rectangular cuboid plotted as a function of distance from the glomerular edge. Note that the analyzed dendritic volume was largest within the first 2 µm from the edge. D. Densities of OSN synapses (red) and gap junctions (teal) normalized to the volume of dendrite analyzed plotted as a function of distance from the glomerular edge. The density of OSN synapses (red line) was highest close to the glomerular edge, whereas the density of gap junctions (teal line) remained more consistent.

