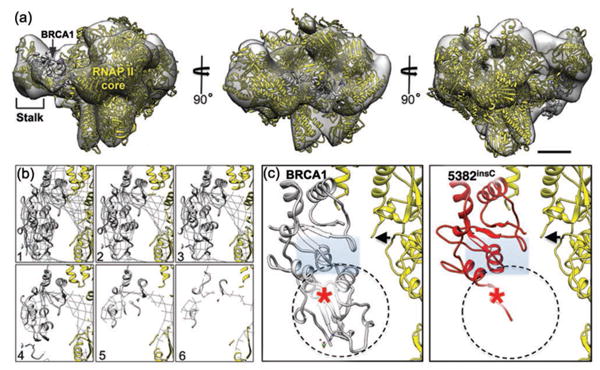
Figure 3. Structural biology interpretation of the isolated BRCA1 assemblies.

(a) The 3D density map calculated from cryo-EM images of BRCA1 assemblies shown in different orientations. The structure contains the RNAP II core (yellow; pdbcode, 4A93) [12] and the BRCA1 C-terminal domain (gray; pdbcode, 1JNX) [13] adjacent to the RNAP II stalk. Scale bar is 10 nm. (b) Cross-sections (1 – 6) are shown in the region of the density map that contains the BRCT domain. (c) A close-up view of the BRCA1 C-terminal domain (gray) in the left panel shows the peptide-binding pocket (gray rectangle). The homology model of the mutated BRCA15382insC protein (red) reveals the binding pocket is significantly disrupted in the mutated domain. A red star indicated the location of the mutated amino acid adjacent to the RNAP II core (black arrow) [8].
